Recurrence-based Analyses
Source code for this document is found here.
# emadata <- readr::read_rds("./data/EMA_data_Moti_P10.csv")
# readr::write_csv(emadata, "./data/EMA_data_Moti_P10.csv")
emadata <- readr::read_csv("./data/EMA_data_Moti_P10.csv")

emadata_nested <- emadata %>% dplyr::group_by(User) %>%
                  dplyr::select(#autonomy, competence, relatedness,
                                pleasure, interest, importance,
                                situation_requires = required,
                                anxiety_guilt_avoidance = anxiety_guilt,
                                another_wants = for_others,
                                Date = dateTime,
                                User,
                                task) %>%
                  na.omit() %>% ### NOTE! NAs removed!
  tidyr::nest()

# Show sample size for each participant:
# emadata_nested %>%
#   mutate(n = map_dbl(data, nrow))

set.seed(1000)

emadata_nested_wrangled <- emadata_nested %>%
  dplyr::mutate(data = purrr::map(data, ~dplyr::mutate(.x,
                                                       date = as.Date(Date),
                                                       timediff = c(NA, diff(Date))))) %>%
  # Filter out answers less than 15 minutes from the last one, then remove the difference variable
  dplyr::mutate(data = purrr::map(data, ~dplyr::filter(.x, timediff > 15))) %>%
  dplyr::mutate(data = purrr::map(data, ~dplyr::select(.x, -timediff))) %>%
  # Create three datasets, where one daily observation is randomly selected from those available:
  dplyr::mutate(sample1 = purrr::map(.x = data,
                                     .f = ~dplyr::group_by(.x, date) %>%
                                       dplyr::sample_n(., size = 1, replace = FALSE) %>%
                                       dplyr::ungroup())) %>%
  dplyr::mutate(sample2 = purrr::map(.x = data,
                                     .f = ~dplyr::group_by(.x, date) %>%
                                       dplyr::sample_n(., size = 1, replace = FALSE) %>%
                                       dplyr::ungroup())) %>%
  dplyr::mutate(sample3 = purrr::map(.x = data,
                                     .f = ~dplyr::group_by(.x, date) %>%
                                       dplyr::sample_n(., size = 1, replace = FALSE) %>%
                                       dplyr::ungroup())) %>%
  # Create "task-normed" variables, where the previous instance of the task is substracted from the current one:
  dplyr::mutate(taskNormed = purrr::map(data, ~dplyr::group_by(., task))) %>%
  dplyr::mutate(taskNormed = purrr::map(taskNormed, ~dplyr::mutate_if(.x, is.numeric, ~(.-lag(.))))) %>%
  dplyr::mutate(taskNormed = purrr::map(taskNormed, ~na.omit(.x))) %>%
  dplyr::mutate(taskNormed = purrr::map(taskNormed, ~dplyr::ungroup(.x))) %>%
  dplyr::mutate(taskNormed = purrr::map(taskNormed, ~dplyr::mutate_if(.x,
                                                                      is.numeric,
                                                                      ~scales::rescale(.x,
                                                                                       to = c(0, 49))))) %>%
  # # Take daily averages to ensure ~equally spaced observations:
  dplyr::mutate(data_daily = purrr::map(data,
                                        ~dplyr::group_by(., date))) %>%
  dplyr::mutate(data_daily = purrr::map(data_daily,
                                        ~dplyr::summarise_if(.x, is.numeric, mean, na.rm = TRUE))) %>%
  # Remove day and task variables
  dplyr::mutate(data_with_tasks_and_dates = data,
                data = purrr::map(data, ~dplyr::select(.x, -Date, -date, -task))) %>%
  dplyr::mutate(taskNormed = purrr::map(taskNormed, ~dplyr::select(.x, -Date, -date, -task))) %>%
  dplyr::mutate(data_daily_with_tasks_and_dates = data_daily,
                data_daily = purrr::map(data_daily, ~dplyr::select(.x, -date))) %>%
  # Normalise all numeric variables
  dplyr::mutate(data_standardised = purrr::map(data, ~dplyr::mutate_if(.x, is.numeric,
                                                           ~((.x / max(.x)))))) %>%
  dplyr::mutate(sample1_standardised = purrr::map(sample1, ~dplyr::mutate_if(.x, is.numeric,
                                                           ~((.x / max(.x)))))) %>%
  dplyr::mutate(sample2_standardised = purrr::map(sample2, ~dplyr::mutate_if(.x, is.numeric,
                                                           ~((.x / max(.x)))))) %>%
  dplyr::mutate(sample3_standardised = purrr::map(sample3, ~dplyr::mutate_if(.x, is.numeric,
                                                           ~((.x / max(.x)))))) %>%
  dplyr::mutate(data_daily_standardised = purrr::map(data_daily, ~dplyr::mutate_if(.x, is.numeric,
                                                           ~((.x / max(.x)))))) %>%
  dplyr::mutate(taskNormed_standardised = purrr::map(taskNormed, ~dplyr::mutate_if(.x, is.numeric,
                                                           ~((.x / max(.x)))))) %>%
  # Retain first and last observation of the day:
  dplyr::mutate(data_firstlast_divided_by_max = purrr::map(.x = data_with_tasks_and_dates,
                                           .f = ~dplyr::group_by(.x, date) %>%
                                             dplyr::arrange(Date) %>%
                                             dplyr::filter(row_number() == 1 | row_number() == n()) %>%
                                             dplyr::ungroup() %>%
                                             dplyr::mutate_if(., is.numeric,
                                                              ~(. / max(., na.rm = TRUE)))),
                data_firstlast_divided_by_max_with_tasks_and_dates = data_firstlast_divided_by_max,
                data_firstlast_divided_by_max = purrr::map(data_firstlast_divided_by_max,
                                                           ~dplyr::select(.x, -Date, -date, -task)))
In this document, we provide supplementary information about recurrence-based analyses. We also provide code for the figures in the manuscript.
Note: We use the terms motivational attractor, profile and configuration interchangeably in this context.
Recurrence quantification and recurrence network analysis
As described in the manuscript, to explore the dynamics of a phenomenon while making no assumptions about distributional shapes of observations or their errors, about linearity, or about the time-lags involved, researchers can perform Recurrence Quantification Analysis, which provides a visual intuition about the temporal organisation of a system. There are two flavours of recurrence-based analysis: Recurrence Quantification Analysis (RQA), which quantifies the dynamics and temporal patterns of the states of a system (Marwan et al. 2007) and Recurrence Network Analysis, which quantifies the geometric structure and evolution of the system in a multidimensional state space (Zou et al. 2019).
- Marwan, N., Romano, M. C., Thiel, M., & Kurths, J. (2007). Recurrence plots for the analysis of complex systems. Physics Reports, 438(5), 237–329. https://doi.org/10.1016/j.physrep.2006.11.001
- Zou, Y., Donner, R. V., Marwan, N., Donges, J. F., & Kurths, J. (2019). Complex network approaches to nonlinear time series analysis. Physics Reports, 787, 1–97. https://doi.org/10.1016/j.physrep.2018.10.005
The first step of the analysis is to plot the data points with their distances to all other data points in a matrix, as shown in the left panel of Figure below. Red cells indicate highly similar values, white cells intermediate ones, and blue cells highly dissimilar values. After this, the distance matrix can be thresholded (as in the right panel of Figure 4) by applying a rule, that binarises each cell into recurring (black) or not (white). The rule in Figure below is “preserve recurrences with absolute distance of 1 or less”.
rqa_pedagogical_distance <- magick::image_read("./figures/rqa_pedagogical_distance.png") %>%
  magick::image_border(., color = "white", geometry = "20x10")

rqa_pedagogical_thresholded <- magick::image_read("./figures/rqa_pedagogical_thresholded.png") %>%
  magick::image_border(., color = "white", geometry = "20x10")

magick::image_append(c(rqa_pedagogical_distance, rqa_pedagogical_thresholded))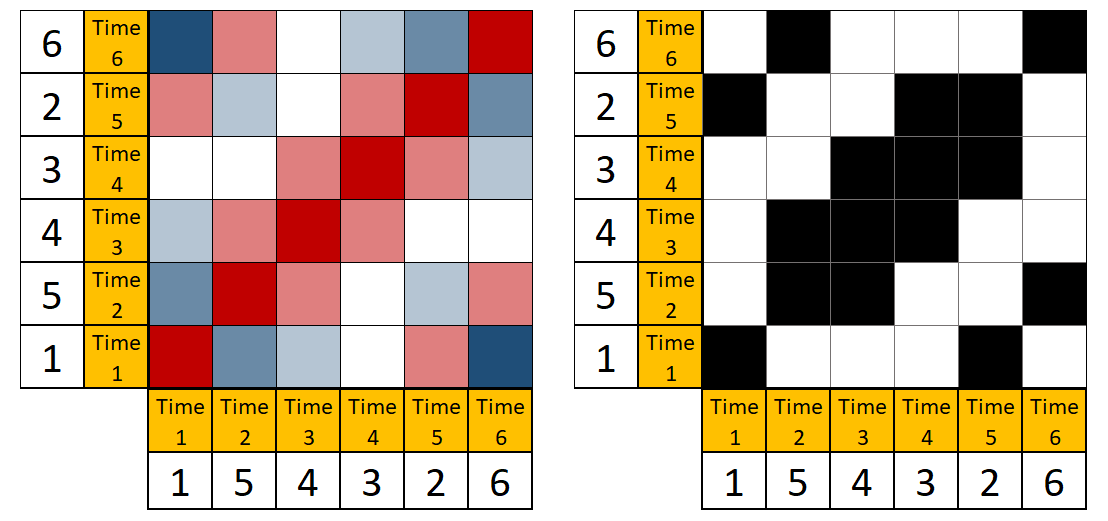
Left: A distance matrix of a hypothetical time series of length 6: {1, 5, 4, 3, 2, 6}. Red cells indicate highly similar values, white cells intermediate ones, and blue cells highly dissimilar values. Right: A recurrence plot created by thresholding the distance matrix such, that only cells indicating distances of 1 or less are preserved.
# grid::grid.raster(png::readPNG("./figures/rqa_pedagogical_distance.png"))While Figure above presents an auto-recurrence plot of a single time series, similar matrices can be used to represent the progression and recurrent states of entire systems over time: Recurrence plots are, in essence, visualisations of distance matrices*, and the distance in a cell can in principle be calculated for an arbitrary number of variables. Figure below presents actual data from one participant, where—instead of single values—the time points consist of configurations of six motivation-related variables (the same as in manuscript’s Figure with the time-varying vector autoregressive model). The thresholding rule in the right panel of the plot is “preserve only 5% of the closest configurations”, with closeness defined as proximity of coordinates in six-dimensional space. A visual inspection of Figure below shows that the recurrent states mostly happen in the second half of the study period. Quantifying patterns produced by recurrence plots, that is, deriving complexity measures from them, can tell important information about the system the data represents.
*We used the Euclidean distance, which can be problematic under fat tails. But given that the analysis aims to unveil oft-recurring configurations instead of rare extreme ones, this is less of a concern: Extreme states would simply show up as unique or uncategorised in the analysis.
grid::grid.raster(png::readPNG("./figures/rqa_biplot.png"))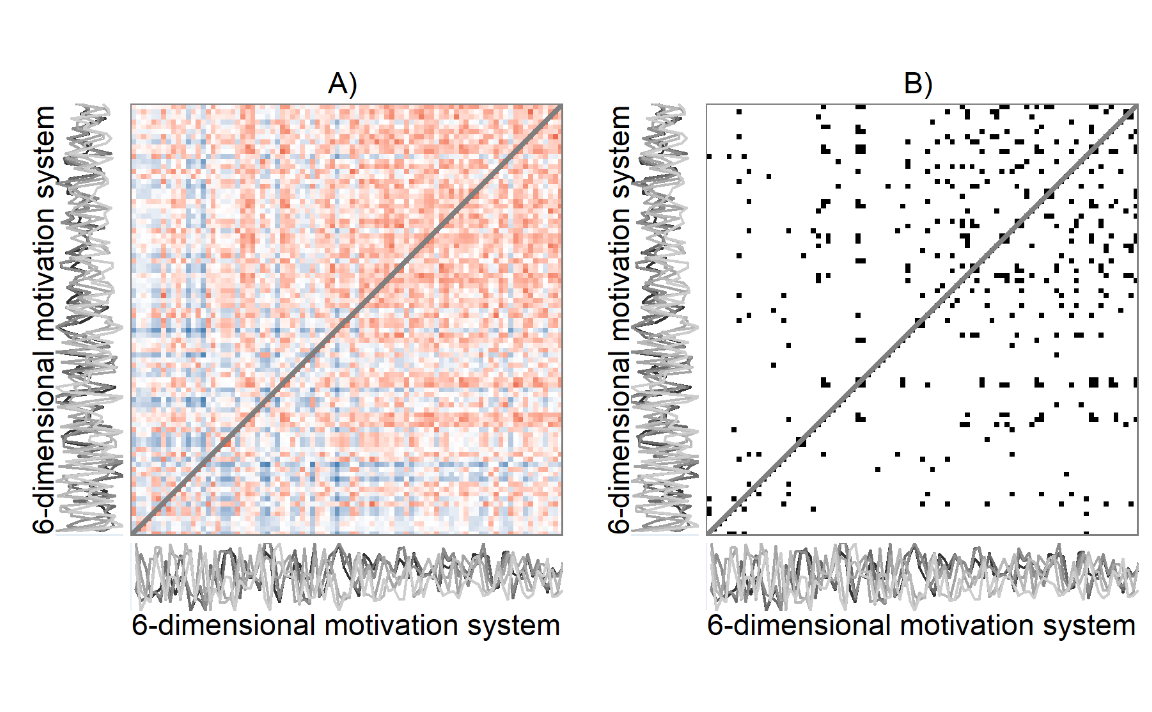
A 6-variable motivation system of a single participant. Panel A depicts an unthresholded distance matrix, where each cell represents a measurement occasion, with red colours indicating the value is close to the corresponding time point on the other axis, while blue colours indicate the contrary, and white implies an intermediate distance. Panel B is a recurrence plot, where this unthresholded plot has been binarised with the rule of retaining only 5% of the closest recurrences. Drawn with R package casnet.
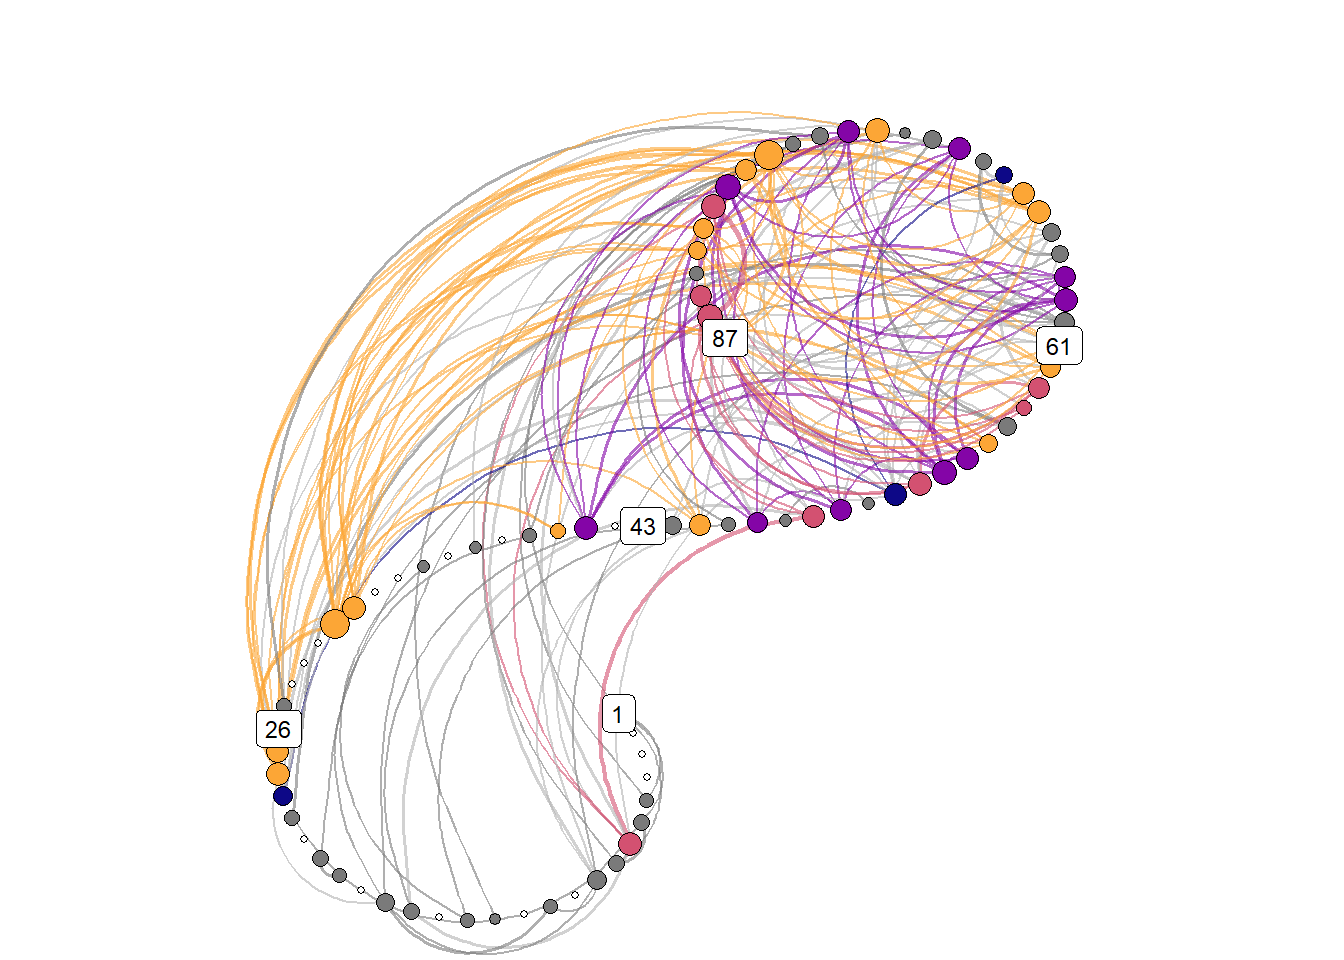
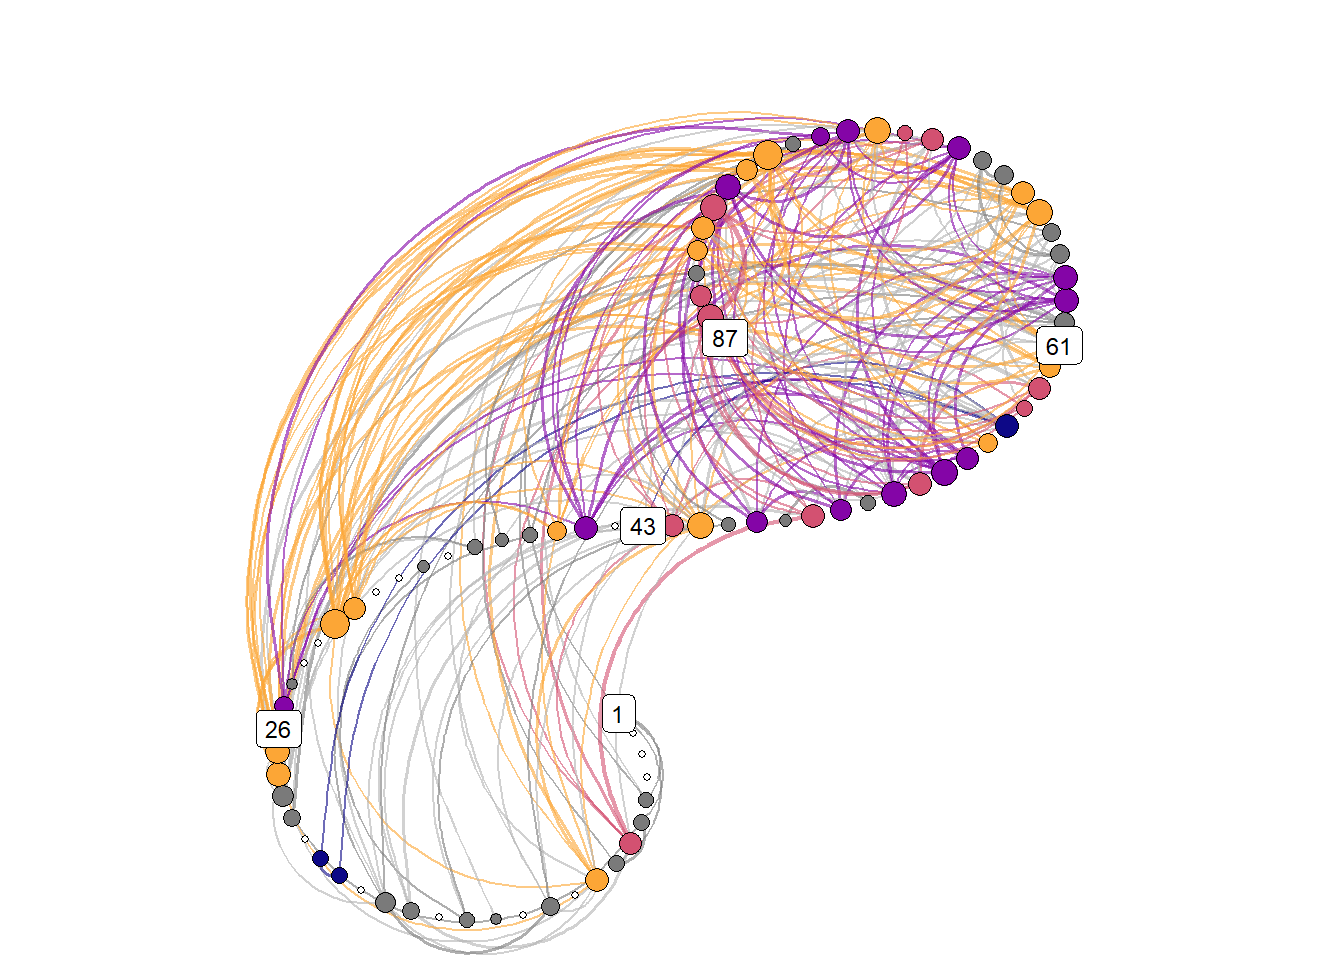
Due to the recurrence plot being in essence a distance matrix, they can also be represented as networks, with time points as nodes – connected by lines if they are close enough to correspond to a configuration observed in some previous time point.
Recurrence network demonstration
The participant was beeped 5 times a day for all the questions, during an 8-hour period they determined as their workday – see here for details. In order to meet the requirement of approximately equidistant measures as well as possible, in the analysis presented in the manuscript, we chose to only use the first and last observation of the day (when more than 2 time points were available for a given day).
Below, we present other choices that could have been made as sensitivity analyses. Results in three tabs come from sampling one time point randomly from all available measurement occasions each day, with the aim of fulfilling the equidistance requirement as well as possible. We also present results for using all the data, ignoring the equidistance requirement completely. Lastly, we present results for “task-norming” the data – that is, substracting from the current six values of the variables, those from the previous time the task was conducted (and ignoring the equidistance requirement). It can be seen, that most of the profiles can be found from analysis, although their order may differ. We opted not to take the average of daily measures, as the ecological momentary assessment questions were tied to the particular tasks and moments at hand, and an average would not have necessarily represented any of the occasions it consisted of.
First and last daily observations
Here’s the 6-dimensional motivation system’s recurrence plot, weighted by similarity.
set.seed(100)

#######################

# si = similarity under the radius
emadata_nested_wrangled_both_recnets <- emadata_nested_wrangled %>%
  dplyr::mutate(RN = purrr::map(.x = data_firstlast_divided_by_max,
                                .f =  ~casnet::rn(.x %>% dplyr::select(#autonomy, competence, relatedness,
                                                                       pleasure, interest, importance,
                                                                       situation_requires,
                                                                       anxiety_guilt_avoidance,
                                                                       another_wants),
                                                  doEmbed = FALSE,
                                                  weighted = TRUE,
                                                  weightedBy = "si",
                                                  targetValue = 0.05,
                                                  emRad = NA)))
##
## Auto-recurrence: Setting diagonal to (1 + max. distance) for analyses
##
## Searching for a radius that will yield 0.05 for RR

emadata_nested_wrangled_both_recnets <- emadata_nested_wrangled_both_recnets %>%
  dplyr::mutate(graph_from_adjacency = purrr::map(.x = RN,
                                                  .f = ~igraph::graph_from_adjacency_matrix(.x,
                                                                                            weighted = TRUE,
                                                                                            mode = "upper",
                                                                                            diag = FALSE)))

# Edges with their distances
emadata_nested_wrangled_both_recnets <- emadata_nested_wrangled_both_recnets %>%
  dplyr::mutate(edges_with_distances = purrr::map(.x = graph_from_adjacency,
                                                  .f = ~igraph::E(.x)$weight),
                graph_from_adjacency_orig = graph_from_adjacency)

# Larger values are closer to the state; inverse of weight makes it more intuitive
for (i in 1:nrow(emadata_nested_wrangled_both_recnets)) {
igraph::E(emadata_nested_wrangled_both_recnets$graph_from_adjacency[[i]])$weight <- (1/emadata_nested_wrangled_both_recnets$edges_with_distances[[i]])
}
# A later note to self: Now weight is a measure of distance; how far apart two time points are
# (under the radius, i.e. they're reasonably similar to begin with)

####### To check:
# igraph::E(emadata_nested_wrangled_both_recnets$graph_from_adjacency[[1]])$weight
# igraph::E(emadata_nested_wrangled_both_recnets$graph_from_adjacency_orig[[1]])$weight

emadata_nested_wrangled_both_recnets <- emadata_nested_wrangled_both_recnets %>%
  dplyr::mutate(RN_plot = purrr::map(.x = RN,
                                .f =  ~casnet::rn_plot(.x,
                                                       plotDimensions = TRUE,
                                                       xlab = "6-dimensional motivation system",
                                                       ylab = "6-dimensional motivation system")))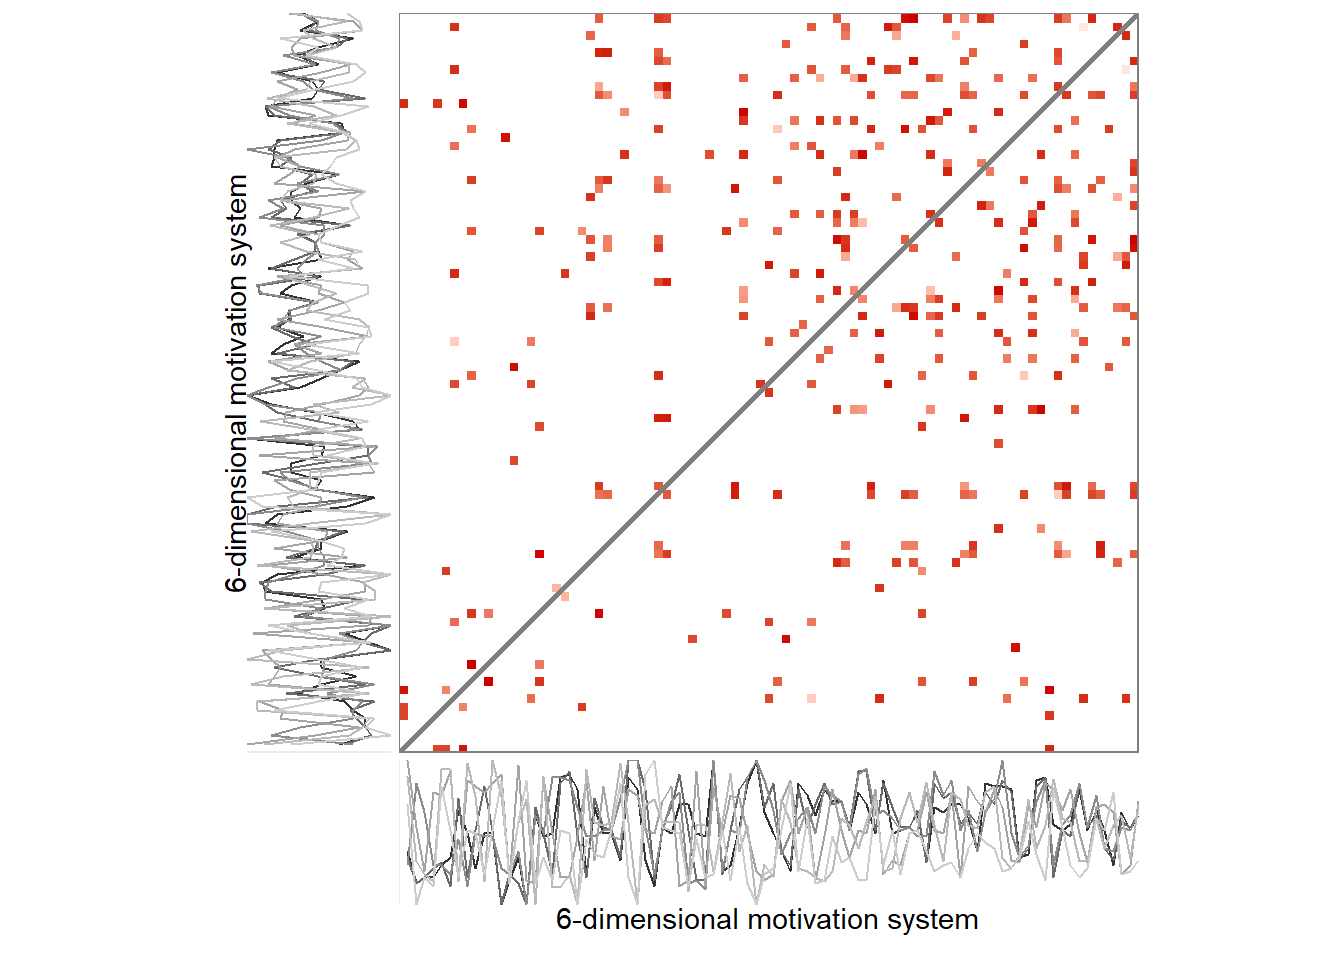
# Make node size equal to strength. Strength is the sum of a node's edge weights.
for (i in 1:nrow(emadata_nested_wrangled_both_recnets)) {
igraph::V(emadata_nested_wrangled_both_recnets$graph_from_adjacency[[i]])$size <- (igraph::strength(emadata_nested_wrangled_both_recnets$graph_from_adjacency[[i]]))
}

# Rescaling weight as "width"; varies between 5 and 10
for (i in 1:nrow(emadata_nested_wrangled_both_recnets)) {
igraph::E(emadata_nested_wrangled_both_recnets$graph_from_adjacency[[i]])$width <-
  casnet::elascer(igraph::E(emadata_nested_wrangled_both_recnets$graph_from_adjacency[[i]])$weight, lo = 5, hi = 10)
}
The lengthy code chunk below extracts and marks attractors in the data. The code first finds the node with largest strength centrality, then classifies all nodes connecting to it as the attractor labelled “1st”. Then it looks for the node with second largest strength centrality, which does not connect to the first, and labelles all nodes connecting to it as “2nd, and so forth. If the 6-variable configuration could be classified under several attractors, our”algorithm" categorises it under the strongest pattern it connects to.
# Get number of maximally connected node
emadata_nested_wrangled_both_recnets_nodes <- emadata_nested_wrangled_both_recnets %>%
dplyr::mutate(strongest_day = purrr::map(.x = graph_from_adjacency,
.f = ~which.max(igraph::strength(.x))
))
emadata_nested_wrangled_both_recnets_nodes <- emadata_nested_wrangled_both_recnets_nodes %>%
dplyr::mutate(list_of_edges = purrr::map(.x = graph_from_adjacency,
.f = ~igraph::get.data.frame(.x)
))
emadata_nested_wrangled_both_recnets_nodes <- emadata_nested_wrangled_both_recnets_nodes %>%
dplyr::mutate(all_nodes_with_strengths =
purrr::map2(.x = data_firstlast_divided_by_max,
.y = graph_from_adjacency,
.f = ~{
data.frame(.x,
strength = igraph::strength(.y)) %>%
dplyr::mutate(time = dplyr::row_number()) %>%
tidyr::pivot_longer(cols = c(-strength, -time))
}
))
# Extract nodes (i.e. times) which connect to the strongest (i.e. most connected) node
emadata_nested_wrangled_both_recnets_nodes <- emadata_nested_wrangled_both_recnets_nodes %>%
dplyr::mutate(connecting_to_strongest = purrr::map2(.x = list_of_edges,
.y = strongest_day,
.f = ~{
.x %>% dplyr::filter(from == .y | to == .y) %>%
dplyr::arrange(weight) %>%
tidyr::pivot_longer(cols = c(from, to),
values_to = "node") %>%
dplyr::distinct(node,
#.keep_all = TRUE
) %>%
dplyr::pull(node)
}
)
)
emadata_nested_wrangled_both_recnets_nodes <- emadata_nested_wrangled_both_recnets_nodes %>%
dplyr::mutate(all_nodes_with_strengths = purrr::map2(.x = all_nodes_with_strengths,
.y = connecting_to_strongest,
.f = ~{
dplyr::mutate(.x,
connecting_to_strongest =
dplyr::case_when(time %in% .y ~ TRUE,
TRUE ~ FALSE))
}
))
# Get number of 2nd maximally connected node, which doesn't connect to the 1st
emadata_nested_wrangled_both_recnets_nodes <- emadata_nested_wrangled_both_recnets_nodes %>%
dplyr::mutate(secondary_attractor_day = purrr::map2(.x = graph_from_adjacency,
.y = connecting_to_strongest,
.f = ~{
data.frame(strength = igraph::strength(.x),
time = 1:length(igraph::strength(.x))) %>%
dplyr::filter(!time %in% .y) %>%
dplyr::arrange(desc(strength)) %>%
dplyr::slice(1) %>%
dplyr::pull(time)
}
))
# Extract nodes (i.e. times) which connect to the 2nd strongest node, which doesn't connect to the 1st
emadata_nested_wrangled_both_recnets_nodes <- emadata_nested_wrangled_both_recnets_nodes %>%
dplyr::mutate(connecting_to_2nd_strongest = purrr::map2(.x = list_of_edges,
.y = secondary_attractor_day,
.f = ~{
.x %>% dplyr::filter(from == .y | to == .y) %>%
dplyr::arrange(weight) %>%
tidyr::pivot_longer(cols = c(from, to),
values_to = "node") %>%
dplyr::distinct(node,
#.keep_all = TRUE
) %>%
dplyr::pull(node)
}
)
)
# Save as a variable in the dataset
emadata_nested_wrangled_both_recnets_nodes <- emadata_nested_wrangled_both_recnets_nodes %>%
dplyr::mutate(all_nodes_with_strengths = purrr::map2(.x = all_nodes_with_strengths,
.y = connecting_to_2nd_strongest,
.f = ~{
dplyr::mutate(.x,
connecting_to_2nd_strongest =
dplyr::case_when(time %in% .y ~ TRUE,
TRUE ~ FALSE))
}
))
# Get number of 3rd maximally connected node, which doesn't connect to the 1st or second
emadata_nested_wrangled_both_recnets_nodes <- emadata_nested_wrangled_both_recnets_nodes %>%
dplyr::mutate(tertiary_attractor_day = purrr::pmap(list(..1 = graph_from_adjacency,
..2 = connecting_to_strongest,
..3 = connecting_to_2nd_strongest),
.f = ~{
data.frame(strength = igraph::strength(..1),
time = 1:length(igraph::strength(..1))) %>%
dplyr::filter(!time %in% ..2,
!time %in% ..3) %>%
dplyr::arrange(desc(strength)) %>%
dplyr::slice(1) %>%
dplyr::pull(time)
}
))
# Extract nodes (i.e. times) which connect to the 3rd strongest node
emadata_nested_wrangled_both_recnets_nodes <- emadata_nested_wrangled_both_recnets_nodes %>%
dplyr::mutate(connecting_to_3rd_strongest = purrr::map2(.x = list_of_edges,
.y = tertiary_attractor_day,
.f = ~{
.x %>% dplyr::filter(from == .y | to == .y) %>%
dplyr::arrange(weight) %>%
tidyr::pivot_longer(cols = c(from, to),
values_to = "node") %>%
dplyr::distinct(node,
#.keep_all = TRUE
) %>%
dplyr::pull(node)
}
)
)
# Save as a variable
emadata_nested_wrangled_both_recnets_nodes <- emadata_nested_wrangled_both_recnets_nodes %>%
dplyr::mutate(all_nodes_with_strengths = purrr::map2(.x = all_nodes_with_strengths,
.y = connecting_to_3rd_strongest,
.f = ~{
dplyr::mutate(.x,
connecting_to_3rd_strongest =
dplyr::case_when(time %in% .y ~ TRUE,
TRUE ~ FALSE))
}
))
# Get number of 4th maximally connected node, which doesn't connect to the 1st, 2nd, or 3rd
emadata_nested_wrangled_both_recnets_nodes <- emadata_nested_wrangled_both_recnets_nodes %>%
dplyr::mutate(fourth_attractor_day = purrr::pmap(list(..1 = graph_from_adjacency,
..2 = connecting_to_strongest,
..3 = connecting_to_2nd_strongest,
..4 = connecting_to_3rd_strongest),
.f = ~{
data.frame(strength = igraph::strength(..1),
time = 1:length(igraph::strength(..1))) %>%
dplyr::filter(!time %in% ..2,
!time %in% ..3,
!time %in% ..4) %>%
dplyr::arrange(desc(strength)) %>%
dplyr::slice(1) %>%
dplyr::pull(time)
}
))
# Extract nodes (i.e. times) which connect to the 4th strongest node
emadata_nested_wrangled_both_recnets_nodes <- emadata_nested_wrangled_both_recnets_nodes %>%
dplyr::mutate(connecting_to_4th_strongest = purrr::map2(.x = list_of_edges,
.y = fourth_attractor_day,
.f = ~{
.x %>% dplyr::filter(from == .y | to == .y) %>%
dplyr::arrange(weight) %>%
tidyr::pivot_longer(cols = c(from, to),
values_to = "node") %>%
dplyr::distinct(node,
#.keep_all = TRUE
) %>%
dplyr::pull(node)
}
)
)
# Save as a variable
emadata_nested_wrangled_both_recnets_nodes <- emadata_nested_wrangled_both_recnets_nodes %>%
dplyr::mutate(all_nodes_with_strengths = purrr::map2(.x = all_nodes_with_strengths,
.y = connecting_to_4th_strongest,
.f = ~{
dplyr::mutate(.x,
connecting_to_4th_strongest =
dplyr::case_when(time %in% .y ~ TRUE,
TRUE ~ FALSE))
}
))
################### Make plots
emadata_nested_wrangled_both_recnets_nodes_plots <- emadata_nested_wrangled_both_recnets_nodes %>%
dplyr::mutate(all_nodes_with_strengths =
purrr::map(.x = all_nodes_with_strengths,
.f = ~{
dplyr::mutate(.x,
attractors = dplyr::case_when(
strength == 0 ~ "Unique",
connecting_to_strongest == TRUE ~ "1st",
connecting_to_2nd_strongest == TRUE ~ "2nd",
connecting_to_3rd_strongest == TRUE ~ "3rd",
connecting_to_4th_strongest == TRUE ~ "4th",
TRUE ~ "Uncategorised"),
attractors = factor(attractors,
levels = c("1st",
"2nd",
"3rd",
"4th",
"Uncategorised",
"Unique")),
name = factor(name,
levels = c("pleasure",
"interest",
"importance",
"situation_requires",
"anxiety_guilt_avoidance",
"another_wants"),
labels = c("Pleasure",
"Interest",
"Importance",
"Situation requires",
"Anxiety guilt avoidance",
"Another wants")) %>%
forcats::fct_drop()) %>%
dplyr::group_by(attractors, name) %>%
dplyr::mutate(n = n()) %>%
dplyr::ungroup() %>%
dplyr::mutate(maxtime = max(time),
percentage_of_total =
(n / maxtime) %>% scales::percent(accuracy = 0.1),
proportion_of_total = n/maxtime,
attractors_n =
factor(paste0(attractors,
" (n = ", n, "; ",
percentage_of_total, ")")))
}
))Spiral graph with colored nodes
emadata_nested_wrangled_both_recnets_nodes_plots <- emadata_nested_wrangled_both_recnets_nodes_plots %>%
  dplyr::mutate(node_colors = purrr::map(.x = all_nodes_with_strengths,
                                         .f = ~{tidyr::pivot_wider(.x, names_from = name) %>%
                                             dplyr::pull(attractors)}))

for (i in 1:nrow(emadata_nested_wrangled_both_recnets_nodes_plots)) {
levels(emadata_nested_wrangled_both_recnets_nodes_plots$node_colors[[i]]) <-
  c(viridisLite::plasma(4,
                      end = 0.8,
                      direction = -1), "gray48", "white")
  }

emadata_nested_wrangled_both_recnets_nodes_plots <- emadata_nested_wrangled_both_recnets_nodes_plots %>%
  dplyr::mutate(spiralgraph_epochs = purrr::pmap(list(..1 = graph_from_adjacency,
                                          ..2 = node_colors,
                                          ..3 = User),
                                     .f =  ~casnet::make_spiral_graph(g = ..1,
                                                                      arcs = 4,
                                                                      # a = .1,
                                                                      # b = 2,
                                                                      markTimeBy = TRUE,
                                                                      markEpochsBy = ..2,
                                                                      epochColours = ..2,
                                                                      showEpochLegend = FALSE,
                                                                      scaleEdgeSize = 1/10,
                                                                      scaleVertexSize = c(1, 5),
                                                                      showSizeLegend = FALSE,
                                                                      sizeLabel = "Node strength",
                                                                      type = "Euler",
                                                                      # alphaE = 0.1
                                                                      # title = ..3
                                     )))
# emadata_nested_wrangled_both_recnets_nodes_plots$spiralgraph_epochs[[1]] +
#   theme(plot.margin=grid::unit(c(0,0,0,0), "mm"))

# ggsave(filename = "./figures/recnetwork.png",
#        width = 7,
#        height = 7)

# emadata_nested_wrangled_both_recnets_nodes_plots$all_nodes_with_strengths[[1]]
Attractor plot
emadata_nested_wrangled_both_recnets_nodes_plots <- emadata_nested_wrangled_both_recnets_nodes_plots %>%
  dplyr::mutate(observations = purrr::map_dbl(.x = data_firstlast_divided_by_max,
                                              .f = ~nrow(.)))

emadata_nested_wrangled_both_recnets_nodes_plots <- emadata_nested_wrangled_both_recnets_nodes_plots %>%
  dplyr::mutate(observations_daily = purrr::map_dbl(.x = data_daily,
                                              .f = ~nrow(.)))


emadata_nested_wrangled_both_recnets_nodes_plots <- emadata_nested_wrangled_both_recnets_nodes_plots %>%
  dplyr::mutate(
    attractor_plots =
      purrr::pmap(list(..1 = all_nodes_with_strengths,
                       ..2 = observations,
                       ..3 = observations_daily,
                       ..4 = User),
                  .f = ~{
                    dplyr::mutate(..1,
                                  strength_rescaled =
                                    scales::rescale(strength, to = c(0.3, 1.1)),
                                  alpha_strength = ifelse(strength_rescaled == 0.3,
                                                          0.5,
                                                          strength_rescaled)) %>%
                      ggplot(data = .,
                             aes(x = forcats::fct_rev(name),
                                 y = value,
                                 size = strength_rescaled,
                                 alpha = alpha_strength,
                                 color = attractors_n)) +
                      scale_size_identity() +
                      scale_alpha_identity() +
                      geom_point(aes(alpha = alpha_strength)) +
                      geom_line(aes(group = time,
                                    alpha = alpha_strength)) +
                      scale_color_manual(values = c(viridisLite::plasma(4,
                                                                        end = 0.8,
                                                                        direction = -1),
                                                    "gray40", "gray50")) +
                      scale_y_continuous(labels = scales::label_percent(accuracy = 1)) +
                      theme_bw() +
                      theme(legend.position = "none") +
                      labs(y = "Percentage of maximum reported value of variable, across full time series",
                           x = NULL,
                           title = #paste0("Participant \"", ..4, "\" - based on ", ..2, " data points (", ..3, " days)")
                                   paste0("Temporal motivation profiles - based on ", ..2, " data points (", ..3, " days)")) +
                      facet_wrap(~attractors_n) +
                      coord_flip(ylim = c(0, 1))
                  }
      ))

emadata_nested_wrangled_both_recnets_nodes_plots$attractor_plots[[1]]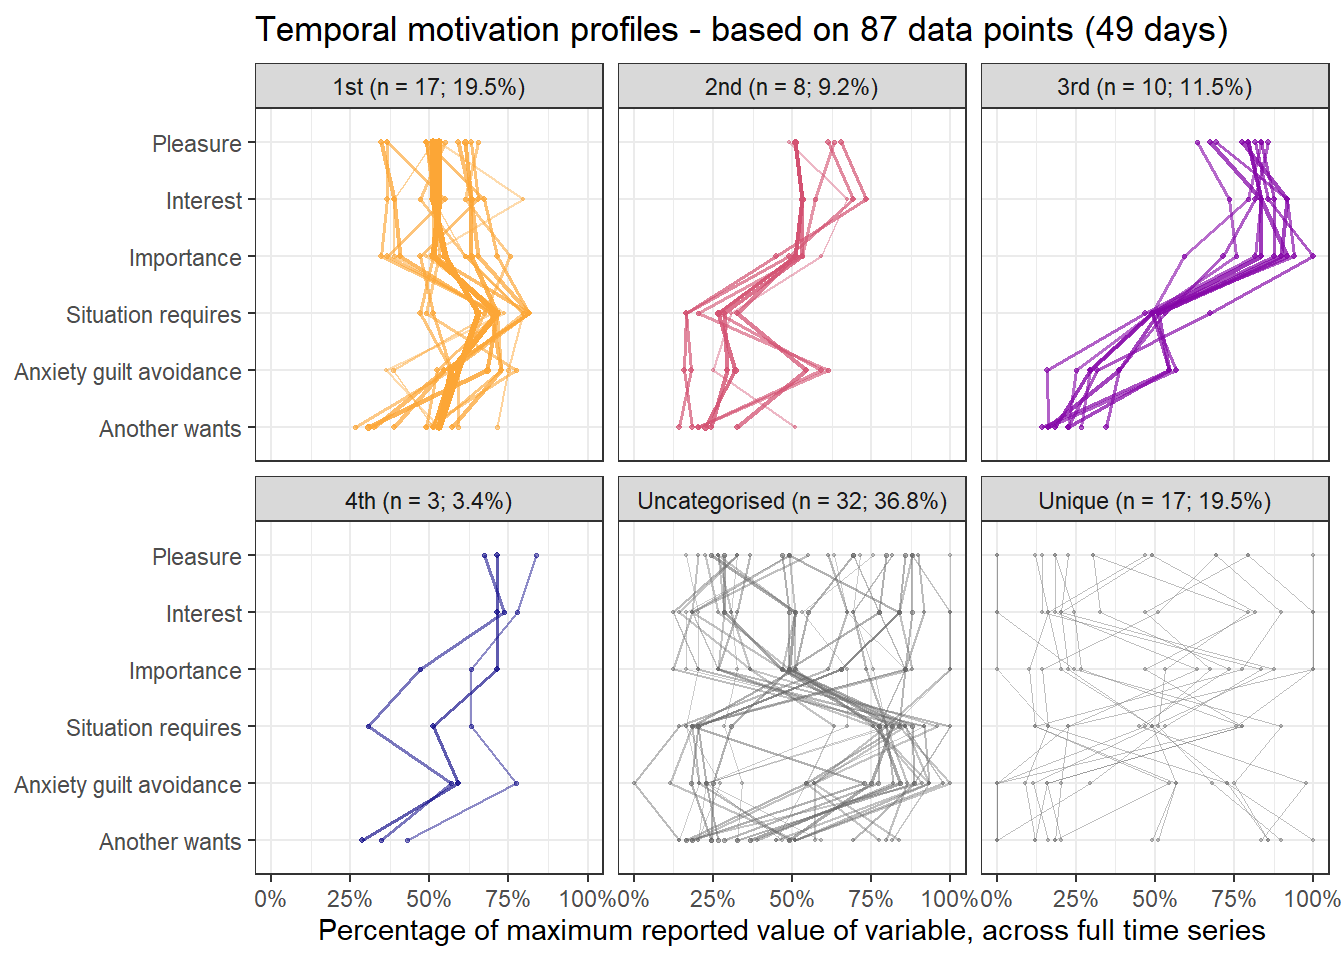
# emadata_nested_wrangled_both_recnets_nodes_plots$all_nodes_with_strengths[[1]]

# Save this to be used for the task analysis later; otherwise overwritten by sensitivity analyses:
firstlast_emadata_nested_wrangled_both_recnets_nodes_plots <-
  emadata_nested_wrangled_both_recnets_nodes_plots

cowplot::save_plot("./figures/attractors.png",
                   emadata_nested_wrangled_both_recnets_nodes_plots$attractor_plots[[1]],
                   dpi = 300,
                   base_height = 11.69/2)
We can observe four main attractors in the plot. The panel labeled 1st shows a relatively balanced profile, with situational requirements slightly elevated. The modal task (see next section) in this profile is internal meetings. The 2nd panel indicates a profile, which is quite high on the pleasure, interest and importance dimensions, with intermediate values on situational requirements and avoiding anxiety or guilt but extrinsic demands are low. This profile, too, is dominated by internal meetings. The 3rd attractor resembles the 1st, but has lower situational requirements and extrinsic demands; the most common task in this profile is email. The 4th attractor shows the theoretically most optimal profile for this person; high on the three autonomous motivation types and low on the controlled motivations. This profile consists of providing training, writing a book, as well as single cases of internal meetings, participating in an event, and reading a report.
A few additional attractors can be seen in the Uncategorised panel. These uncharted, weaker profiles (as measured by their frequency and homogeneity), seem to consist of mostly low profiles on the “another wants” dimension. Two profiles seem to be distinguished; one consisting of high values on pleasure, interest and importance, combined with low values on situational requirements and avoiding anxiety or guilt, whereas another uncategorised profile seems to indicate the opposite of these. Tasks vary widely, the modal ones being internal meetings and email.
The Unique panel depicts profiles that cannot be grouped under one of the other configurations, thus deemed to only occur once. These also consist mostly of internal meetings and email.
Transition networks
attractor_plots <- emadata_nested_wrangled_both_recnets_nodes_plots %>%
dplyr::mutate(relative_freqs = purrr::map(.x = all_nodes_with_strengths,
.f = ~.x %>%
tidyr::pivot_wider(names_from = name,
values_from = value) %>%
dplyr::transmute(previousone = lag(attractors, n = 1),
nextone = attractors) %>%
dplyr::slice(-1) %>%
dplyr::group_by(previousone, nextone) %>%
dplyr::summarise(n = n()) %>%
dplyr::mutate(freq = ((n / sum(n)) * 100) %>%
round(., digits = 0)) %>%
dplyr::select(-n) %>%
data.table::dcast(previousone ~ nextone)))
# absolutes <- emadata_nested_wrangled_both_recnets_nodes_plots$all_nodes_with_strengths[[1]] %>%
# tidyr::pivot_wider(names_from = name,
# values_from = value) %>%
# dplyr::transmute(current = attractors,
# previous = lag(attractors, n = 1)) %>%
# data.table::dcast(current ~ previous)
attractor_plots <- attractor_plots %>%
dplyr::mutate(relative_freqs_plots = purrr::pmap(list(..1 = relative_freqs,
..2 = User),
.f = ~..1 %>%
tidyr::pivot_longer(-previousone,
values_to = "value",
names_to = "nextone") %>%
ggplot(aes(x = previousone,
y = nextone)) +
geom_tile(aes(fill = value),
colour = "black",
size = 0.4) +
# geom_text(aes(label = ifelse(is.na(value),
# ".00",
# (gsub("0\\.",
# "\\.",
# (sprintf("%.2f", value))))))) +
geom_text(aes(label = ifelse(is.na(value),
"0",
value))) +
scale_fill_gradient(low = "white",
high = "red",
na.value = "grey",
guide = "none") +
theme_bw() +
scale_y_discrete(expand = c(0, 0)) +
scale_x_discrete(expand = c(0, 0)) +
theme(axis.text.x = element_text(angle = 30, hjust = 1),
axis.text.y = element_text(angle = 30, hjust = 1),
legend.position = "right",
legend.title = element_blank()) +
coord_equal() +
labs(x = "Previous state", y = "Next state",
title = paste0(#..2, ": ",
"Transitions between the 6-dimensional states"))))
attractor_plots <- attractor_plots %>%
dplyr::mutate(relative_freqs_networks = purrr::pmap(list(..1 = relative_freqs,
..2 = User),
.f = ~..1 %>%
tidyr::pivot_longer(-previousone,
values_to = "value",
names_to = "nextone") %>%
qgraph::qgraph(.,
#layout = "circle",
edgelist = TRUE,
directed = TRUE,
label.scale = FALSE,
trans = TRUE,
layout = "spring",
# lty = .[["line_type"]],
# edge.color = .[["line_colour"]],
# edge.width = .[["line_width"]],
# node.label.position = 3, # If offset doesn't work
# node.label.offset = c(0.5, -2), # x, y
# title = .[["User"]],
# labels = TRUE,
label.cex = 1.25,
probabilityEdges = TRUE,
edge.labels = TRUE,
curveAll = FALSE,
# minimum = 1/6,
asize = 5,
color = c(viridisLite::plasma(4,
end = 0.8,
direction = -1),
"gray48", "white"),
label.color = c("black", "black", "white", "white",
"black", "black"),
filetype = "png",
filename = paste0("./figures/transition_network_", ..2),
mar = c(3, 3, 3, 3) # bottom, left, top, right
)))
relative_freq_network <- grid::rasterGrob(png::readPNG("./figures/transition_network_Moti_P10.png"),
interpolate = TRUE)
png(filename = "figures/transition_grid_network.png",
height = 210*(2/3), width = 297, units = "mm", res = 300)
cowplot::plot_grid(attractor_plots$relative_freqs_plots[[1]],
relative_freq_network,
nrow = 1, labels = c("A)", "B)"))
dev.off()
## png
## 2
knitr::include_graphics("./figures/transition_grid_network.png") ![]()
Robustness to recurrence rate
Here we perform the same analysis, but change the recurrence rate from 5% upwards to 10%.
5%
Here’s the 6-dimensional motivation system’s recurrence plot, weighted by similarity.
recurrence_rate <- 0.05

set.seed(100)

#######################

# si = similarity under the radius
emadata_nested_wrangled_both_recnets <- emadata_nested_wrangled %>%
  dplyr::mutate(RN = purrr::map(.x = data_firstlast_divided_by_max,
                                .f =  ~casnet::rn(.x %>% dplyr::select(#autonomy, competence, relatedness,
                                                                       pleasure, interest, importance,
                                                                       situation_requires,
                                                                       anxiety_guilt_avoidance,
                                                                       another_wants),
                                                  doEmbed = FALSE,
                                                  weighted = TRUE,
                                                  weightedBy = "si",
                                                  emRad = NA,
                                                  targetValue = recurrence_rate)))
##
## Auto-recurrence: Setting diagonal to (1 + max. distance) for analyses
##
## Searching for a radius that will yield 0.05 for RR

emadata_nested_wrangled_both_recnets <- emadata_nested_wrangled_both_recnets %>%
  dplyr::mutate(graph_from_adjacency = purrr::map(.x = RN,
                                                  .f = ~igraph::graph_from_adjacency_matrix(.x,
                                                                                            weighted = TRUE,
                                                                                            mode = "upper",
                                                                                            diag = FALSE)))

# Edges with their distances
emadata_nested_wrangled_both_recnets <- emadata_nested_wrangled_both_recnets %>%
  dplyr::mutate(edges_with_distances = purrr::map(.x = graph_from_adjacency,
                                                  .f = ~igraph::E(.x)$weight),
                graph_from_adjacency_orig = graph_from_adjacency)

# Larger values are closer to the state; inverse of weight makes it more intuitive
for (i in 1:nrow(emadata_nested_wrangled_both_recnets)) {
igraph::E(emadata_nested_wrangled_both_recnets$graph_from_adjacency[[i]])$weight <- (1/emadata_nested_wrangled_both_recnets$edges_with_distances[[i]])
}
# A later note to self: Now weight is a measure of distance; how far apart two time points are
# (under the radius, i.e. they're reasonably similar to begin with)

####### To check:
# igraph::E(emadata_nested_wrangled_both_recnets$graph_from_adjacency[[1]])$weight
# igraph::E(emadata_nested_wrangled_both_recnets$graph_from_adjacency_orig[[1]])$weight

emadata_nested_wrangled_both_recnets <- emadata_nested_wrangled_both_recnets %>%
  dplyr::mutate(RN_plot = purrr::map(.x = RN,
                                .f =  ~casnet::rn_plot(.x,
                                                       plotDimensions = TRUE,
                                                       xlab = "6-dimensional motivation system",
                                                       ylab = "6-dimensional motivation system")))
# Make node size equal to strength. Strength is the sum of a node's edge weights.
for (i in 1:nrow(emadata_nested_wrangled_both_recnets)) {
igraph::V(emadata_nested_wrangled_both_recnets$graph_from_adjacency[[i]])$size <- (igraph::strength(emadata_nested_wrangled_both_recnets$graph_from_adjacency[[i]]))
}

# Rescaling weight as "width"; varies between 5 and 10
for (i in 1:nrow(emadata_nested_wrangled_both_recnets)) {
igraph::E(emadata_nested_wrangled_both_recnets$graph_from_adjacency[[i]])$width <-
  casnet::elascer(igraph::E(emadata_nested_wrangled_both_recnets$graph_from_adjacency[[i]])$weight, lo = 5, hi = 10)
}
The lengthy code chunk below extracts and marks attractors in the data.
# Get number of maximally connected node
emadata_nested_wrangled_both_recnets_nodes <- emadata_nested_wrangled_both_recnets %>%
dplyr::mutate(strongest_day = purrr::map(.x = graph_from_adjacency,
.f = ~which.max(igraph::strength(.x))
))
emadata_nested_wrangled_both_recnets_nodes <- emadata_nested_wrangled_both_recnets_nodes %>%
dplyr::mutate(list_of_edges = purrr::map(.x = graph_from_adjacency,
.f = ~igraph::get.data.frame(.x)
))
emadata_nested_wrangled_both_recnets_nodes <- emadata_nested_wrangled_both_recnets_nodes %>%
dplyr::mutate(all_nodes_with_strengths =
purrr::map2(.x = data_firstlast_divided_by_max,
.y = graph_from_adjacency,
.f = ~{
data.frame(.x,
strength = igraph::strength(.y)) %>%
dplyr::mutate(time = dplyr::row_number()) %>%
tidyr::pivot_longer(cols = c(-strength, -time))
}
))
# Extract nodes (i.e. times) which connect to the strongest (i.e. most connected) node
emadata_nested_wrangled_both_recnets_nodes <- emadata_nested_wrangled_both_recnets_nodes %>%
dplyr::mutate(connecting_to_strongest = purrr::map2(.x = list_of_edges,
.y = strongest_day,
.f = ~{
.x %>% dplyr::filter(from == .y | to == .y) %>%
dplyr::arrange(weight) %>%
tidyr::pivot_longer(cols = c(from, to),
values_to = "node") %>%
dplyr::distinct(node,
#.keep_all = TRUE
) %>%
dplyr::pull(node)
}
)
)
emadata_nested_wrangled_both_recnets_nodes <- emadata_nested_wrangled_both_recnets_nodes %>%
dplyr::mutate(all_nodes_with_strengths = purrr::map2(.x = all_nodes_with_strengths,
.y = connecting_to_strongest,
.f = ~{
dplyr::mutate(.x,
connecting_to_strongest =
dplyr::case_when(time %in% .y ~ TRUE,
TRUE ~ FALSE))
}
))
# Get number of 2nd maximally connected node, which doesn't connect to the 1st
emadata_nested_wrangled_both_recnets_nodes <- emadata_nested_wrangled_both_recnets_nodes %>%
dplyr::mutate(secondary_attractor_day = purrr::map2(.x = graph_from_adjacency,
.y = connecting_to_strongest,
.f = ~{
data.frame(strength = igraph::strength(.x),
time = 1:length(igraph::strength(.x))) %>%
dplyr::filter(!time %in% .y) %>%
dplyr::arrange(desc(strength)) %>%
dplyr::slice(1) %>%
dplyr::pull(time)
}
))
# Extract nodes (i.e. times) which connect to the 2nd strongest node, which doesn't connect to the 1st
emadata_nested_wrangled_both_recnets_nodes <- emadata_nested_wrangled_both_recnets_nodes %>%
dplyr::mutate(connecting_to_2nd_strongest = purrr::map2(.x = list_of_edges,
.y = secondary_attractor_day,
.f = ~{
.x %>% dplyr::filter(from == .y | to == .y) %>%
dplyr::arrange(weight) %>%
tidyr::pivot_longer(cols = c(from, to),
values_to = "node") %>%
dplyr::distinct(node,
#.keep_all = TRUE
) %>%
dplyr::pull(node)
}
)
)
# Save as a variable in the dataset
emadata_nested_wrangled_both_recnets_nodes <- emadata_nested_wrangled_both_recnets_nodes %>%
dplyr::mutate(all_nodes_with_strengths = purrr::map2(.x = all_nodes_with_strengths,
.y = connecting_to_2nd_strongest,
.f = ~{
dplyr::mutate(.x,
connecting_to_2nd_strongest =
dplyr::case_when(time %in% .y ~ TRUE,
TRUE ~ FALSE))
}
))
# Get number of 3rd maximally connected node, which doesn't connect to the 1st or second
emadata_nested_wrangled_both_recnets_nodes <- emadata_nested_wrangled_both_recnets_nodes %>%
dplyr::mutate(tertiary_attractor_day = purrr::pmap(list(..1 = graph_from_adjacency,
..2 = connecting_to_strongest,
..3 = connecting_to_2nd_strongest),
.f = ~{
data.frame(strength = igraph::strength(..1),
time = 1:length(igraph::strength(..1))) %>%
dplyr::filter(!time %in% ..2,
!time %in% ..3) %>%
dplyr::arrange(desc(strength)) %>%
dplyr::slice(1) %>%
dplyr::pull(time)
}
))
# Extract nodes (i.e. times) which connect to the 3rd strongest node
emadata_nested_wrangled_both_recnets_nodes <- emadata_nested_wrangled_both_recnets_nodes %>%
dplyr::mutate(connecting_to_3rd_strongest = purrr::map2(.x = list_of_edges,
.y = tertiary_attractor_day,
.f = ~{
.x %>% dplyr::filter(from == .y | to == .y) %>%
dplyr::arrange(weight) %>%
tidyr::pivot_longer(cols = c(from, to),
values_to = "node") %>%
dplyr::distinct(node,
#.keep_all = TRUE
) %>%
dplyr::pull(node)
}
)
)
# Save as a variable
emadata_nested_wrangled_both_recnets_nodes <- emadata_nested_wrangled_both_recnets_nodes %>%
dplyr::mutate(all_nodes_with_strengths = purrr::map2(.x = all_nodes_with_strengths,
.y = connecting_to_3rd_strongest,
.f = ~{
dplyr::mutate(.x,
connecting_to_3rd_strongest =
dplyr::case_when(time %in% .y ~ TRUE,
TRUE ~ FALSE))
}
))
# Get number of 4th maximally connected node, which doesn't connect to the 1st, 2nd, or 3rd
emadata_nested_wrangled_both_recnets_nodes <- emadata_nested_wrangled_both_recnets_nodes %>%
dplyr::mutate(fourth_attractor_day = purrr::pmap(list(..1 = graph_from_adjacency,
..2 = connecting_to_strongest,
..3 = connecting_to_2nd_strongest,
..4 = connecting_to_3rd_strongest),
.f = ~{
data.frame(strength = igraph::strength(..1),
time = 1:length(igraph::strength(..1))) %>%
dplyr::filter(!time %in% ..2,
!time %in% ..3,
!time %in% ..4) %>%
dplyr::arrange(desc(strength)) %>%
dplyr::slice(1) %>%
dplyr::pull(time)
}
))
# Extract nodes (i.e. times) which connect to the 4th strongest node
emadata_nested_wrangled_both_recnets_nodes <- emadata_nested_wrangled_both_recnets_nodes %>%
dplyr::mutate(connecting_to_4th_strongest = purrr::map2(.x = list_of_edges,
.y = fourth_attractor_day,
.f = ~{
.x %>% dplyr::filter(from == .y | to == .y) %>%
dplyr::arrange(weight) %>%
tidyr::pivot_longer(cols = c(from, to),
values_to = "node") %>%
dplyr::distinct(node,
#.keep_all = TRUE
) %>%
dplyr::pull(node)
}
)
)
# Save as a variable
emadata_nested_wrangled_both_recnets_nodes <- emadata_nested_wrangled_both_recnets_nodes %>%
dplyr::mutate(all_nodes_with_strengths = purrr::map2(.x = all_nodes_with_strengths,
.y = connecting_to_4th_strongest,
.f = ~{
dplyr::mutate(.x,
connecting_to_4th_strongest =
dplyr::case_when(time %in% .y ~ TRUE,
TRUE ~ FALSE))
}
))
################### Make plots
emadata_nested_wrangled_both_recnets_nodes_plots <- emadata_nested_wrangled_both_recnets_nodes %>%
dplyr::mutate(all_nodes_with_strengths =
purrr::map(.x = all_nodes_with_strengths,
.f = ~{
dplyr::mutate(.x,
attractors = dplyr::case_when(
strength == 0 ~ "Unique",
connecting_to_strongest == TRUE ~ "1st",
connecting_to_2nd_strongest == TRUE ~ "2nd",
connecting_to_3rd_strongest == TRUE ~ "3rd",
connecting_to_4th_strongest == TRUE ~ "4th",
TRUE ~ "Uncategorised"),
attractors = factor(attractors,
levels = c("1st",
"2nd",
"3rd",
"4th",
"Uncategorised",
"Unique")),
name = factor(name,
levels = c("pleasure",
"interest",
"importance",
"situation_requires",
"anxiety_guilt_avoidance",
"another_wants"),
labels = c("Pleasure",
"Interest",
"Importance",
"Situation requires",
"Anxiety guilt avoidance",
"Another wants")) %>%
forcats::fct_drop()) %>%
dplyr::group_by(attractors, name) %>%
dplyr::mutate(n = n()) %>%
dplyr::ungroup() %>%
dplyr::mutate(maxtime = max(time),
percentage_of_total =
(n / maxtime) %>% scales::percent(accuracy = 0.1),
proportion_of_total = n/maxtime,
attractors_n =
factor(paste0(attractors,
" (n = ", n, "; ",
percentage_of_total, ")")))
}
))Spiral graph with colored nodes
emadata_nested_wrangled_both_recnets_nodes_plots <- emadata_nested_wrangled_both_recnets_nodes_plots %>%
  dplyr::mutate(node_colors = purrr::map(.x = all_nodes_with_strengths,
                                         .f = ~{tidyr::pivot_wider(.x, names_from = name) %>%
                                             dplyr::pull(attractors)}))

for (i in 1:nrow(emadata_nested_wrangled_both_recnets_nodes_plots)) {
levels(emadata_nested_wrangled_both_recnets_nodes_plots$node_colors[[i]]) <-
  c(viridisLite::plasma(4,
                      end = 0.8,
                      direction = -1), "gray48", "white")
  }

emadata_nested_wrangled_both_recnets_nodes_plots <- emadata_nested_wrangled_both_recnets_nodes_plots %>%
  dplyr::mutate(spiralgraph_epochs = purrr::pmap(list(..1 = graph_from_adjacency,
                                          ..2 = node_colors,
                                          ..3 = User),
                                     .f =  ~casnet::make_spiral_graph(g = ..1,
                                                                      arcs = 4,
                                                                      # a = .1,
                                                                      # b = 2,
                                                                      markTimeBy = TRUE,
                                                                      markEpochsBy = ..2,
                                                                      epochColours = ..2,
                                                                      showEpochLegend = FALSE,
                                                                      scaleEdgeSize = 1/10,
                                                                      scaleVertexSize = c(1, 5),
                                                                      showSizeLegend = FALSE,
                                                                      sizeLabel = "Node strength",
                                                                      type = "Euler",
                                                                      # alphaE = 0.1
                                                                      # title = ..3
                                     )))
# emadata_nested_wrangled_both_recnets_nodes_plots$spiralgraph_epochs[[1]] +
#   theme(plot.margin=grid::unit(c(0,0,0,0), "mm"))

# ggsave(filename = "./figures/recnetwork.png",
#        width = 7,
#        height = 7)

# emadata_nested_wrangled_both_recnets_nodes_plots$all_nodes_with_strengths[[1]]
Attractor plot
emadata_nested_wrangled_both_recnets_nodes_plots <- emadata_nested_wrangled_both_recnets_nodes_plots %>%
  dplyr::mutate(observations = purrr::map_dbl(.x = data_firstlast_divided_by_max,
                                              .f = ~nrow(.)))

emadata_nested_wrangled_both_recnets_nodes_plots <- emadata_nested_wrangled_both_recnets_nodes_plots %>%
  dplyr::mutate(observations_daily = purrr::map_dbl(.x = data_daily,
                                              .f = ~nrow(.)))


emadata_nested_wrangled_both_recnets_nodes_plots <- emadata_nested_wrangled_both_recnets_nodes_plots %>%
  dplyr::mutate(
    attractor_plots =
      purrr::pmap(list(..1 = all_nodes_with_strengths,
                       ..2 = observations,
                       ..3 = observations_daily,
                       ..4 = User),
                  .f = ~{
                    dplyr::mutate(..1,
                                  strength_rescaled =
                                    scales::rescale(strength, to = c(0.3, 1.1)),
                                  alpha_strength = ifelse(strength_rescaled == 0.3,
                                                          0.5,
                                                          strength_rescaled)) %>%
                      ggplot(data = .,
                             aes(x = forcats::fct_rev(name),
                                 y = value,
                                 size = strength_rescaled,
                                 alpha = alpha_strength,
                                 color = attractors_n)) +
                      scale_size_identity() +
                      scale_alpha_identity() +
                      geom_point(aes(alpha = alpha_strength)) +
                      geom_line(aes(group = time,
                                    alpha = alpha_strength)) +
                      scale_color_manual(values = c(viridisLite::plasma(4,
                                                                        end = 0.8,
                                                                        direction = -1),
                                                    "gray40", "gray50")) +
                      scale_y_continuous(labels = scales::label_percent(accuracy = 1)) +
                      theme_bw() +
                      theme(legend.position = "none") +
                      labs(y = "Percentage of maximum reported value of variable, across full time series",
                           x = NULL,
                           title = paste0("Participant \"", ..4, "\" - based on ", ..2, " data points (", ..3, " days)"),
                           caption = paste0("Recurrence rate used for the analysis: ", scales::percent(recurrence_rate))) +
                      facet_wrap(~attractors_n) +
                      coord_flip(ylim = c(0, 1))
                  }
      ))

emadata_nested_wrangled_both_recnets_nodes_plots$attractor_plots[[1]]
# emadata_nested_wrangled_both_recnets_nodes_plots$all_nodes_with_strengths[[1]]

# # Save this to be used for the task analysis later; otherwise overwritten by sensitivity analyses:
# firstlast_emadata_nested_wrangled_both_recnets_nodes_plots <-
#   emadata_nested_wrangled_both_recnets_nodes_plots

# cowplot::save_plot("./figures/attractors.png",
#                    emadata_nested_wrangled_both_recnets_nodes_plots$attractor_plots[[1]],
#                    dpi = 300,
#                    base_height = 11.69/2)
6%
Here’s the 6-dimensional motivation system’s recurrence plot, weighted by similarity.
recurrence_rate <- 0.06

set.seed(100)

#######################

# si = similarity under the radius
emadata_nested_wrangled_both_recnets <- emadata_nested_wrangled %>%
  dplyr::mutate(RN = purrr::map(.x = data_firstlast_divided_by_max,
                                .f =  ~casnet::rn(.x %>% dplyr::select(#autonomy, competence, relatedness,
                                                                       pleasure, interest, importance,
                                                                       situation_requires,
                                                                       anxiety_guilt_avoidance,
                                                                       another_wants),
                                                  doEmbed = FALSE,
                                                  weighted = TRUE,
                                                  weightedBy = "si",
                                                  emRad = NA,
                                                  targetValue = recurrence_rate)))
##
## Auto-recurrence: Setting diagonal to (1 + max. distance) for analyses
##
## Searching for a radius that will yield 0.06 for RR

emadata_nested_wrangled_both_recnets <- emadata_nested_wrangled_both_recnets %>%
  dplyr::mutate(graph_from_adjacency = purrr::map(.x = RN,
                                                  .f = ~igraph::graph_from_adjacency_matrix(.x,
                                                                                            weighted = TRUE,
                                                                                            mode = "upper",
                                                                                            diag = FALSE)))

# Edges with their distances
emadata_nested_wrangled_both_recnets <- emadata_nested_wrangled_both_recnets %>%
  dplyr::mutate(edges_with_distances = purrr::map(.x = graph_from_adjacency,
                                                  .f = ~igraph::E(.x)$weight),
                graph_from_adjacency_orig = graph_from_adjacency)

# Larger values are closer to the state; inverse of weight makes it more intuitive
for (i in 1:nrow(emadata_nested_wrangled_both_recnets)) {
igraph::E(emadata_nested_wrangled_both_recnets$graph_from_adjacency[[i]])$weight <- (1/emadata_nested_wrangled_both_recnets$edges_with_distances[[i]])
}
# A later note to self: Now weight is a measure of distance; how far apart two time points are
# (under the radius, i.e. they're reasonably similar to begin with)

####### To check:
# igraph::E(emadata_nested_wrangled_both_recnets$graph_from_adjacency[[1]])$weight
# igraph::E(emadata_nested_wrangled_both_recnets$graph_from_adjacency_orig[[1]])$weight

emadata_nested_wrangled_both_recnets <- emadata_nested_wrangled_both_recnets %>%
  dplyr::mutate(RN_plot = purrr::map(.x = RN,
                                .f =  ~casnet::rn_plot(.x,
                                                       plotDimensions = TRUE,
                                                       xlab = "6-dimensional motivation system",
                                                       ylab = "6-dimensional motivation system")))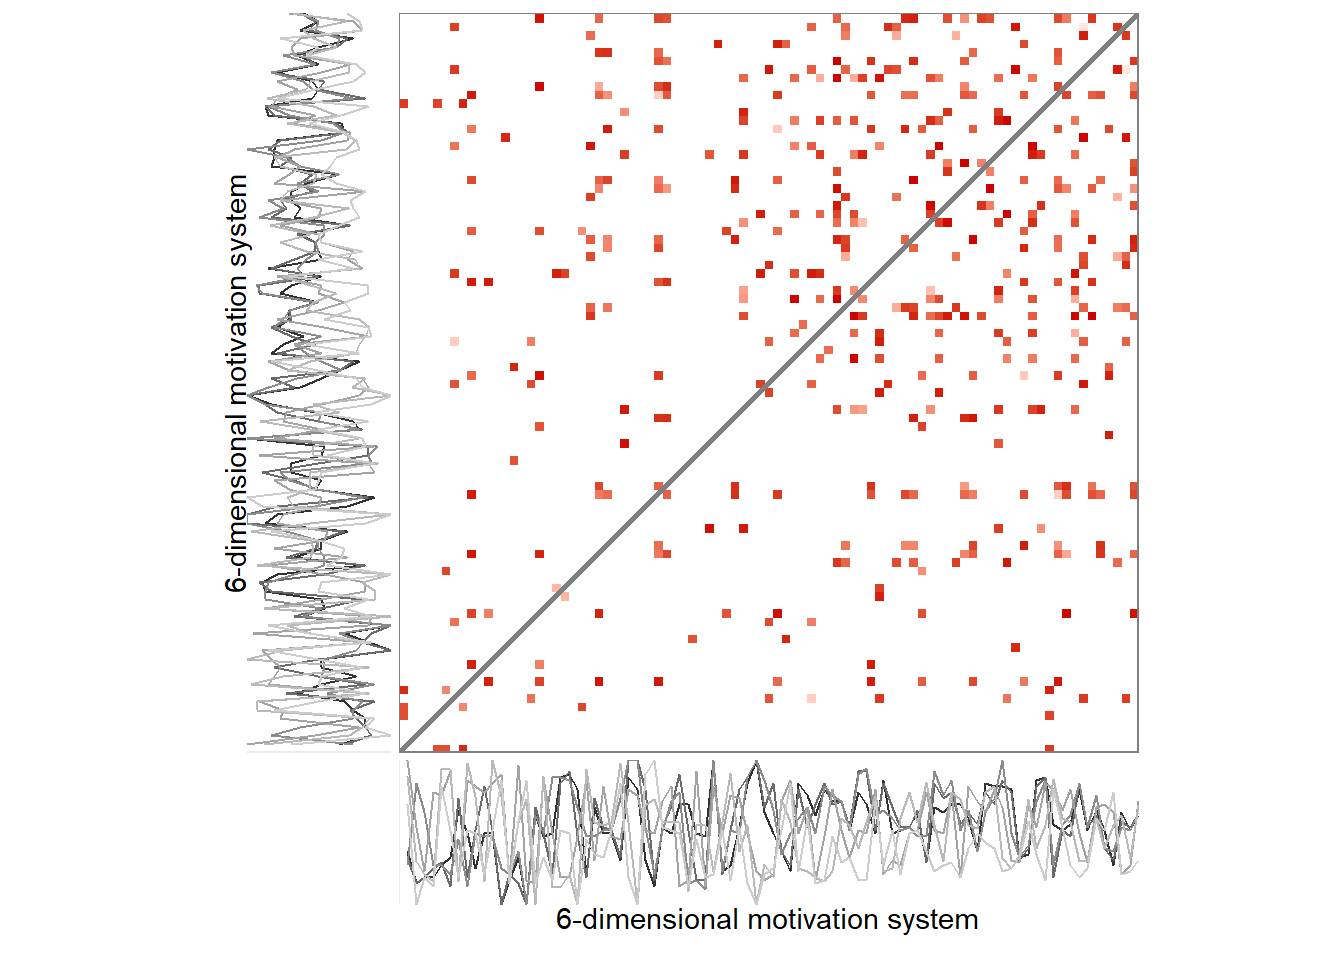
# Make node size equal to strength. Strength is the sum of a node's edge weights.
for (i in 1:nrow(emadata_nested_wrangled_both_recnets)) {
igraph::V(emadata_nested_wrangled_both_recnets$graph_from_adjacency[[i]])$size <- (igraph::strength(emadata_nested_wrangled_both_recnets$graph_from_adjacency[[i]]))
}

# Rescaling weight as "width"; varies between 5 and 10
for (i in 1:nrow(emadata_nested_wrangled_both_recnets)) {
igraph::E(emadata_nested_wrangled_both_recnets$graph_from_adjacency[[i]])$width <-
  casnet::elascer(igraph::E(emadata_nested_wrangled_both_recnets$graph_from_adjacency[[i]])$weight, lo = 5, hi = 10)
}
The lengthy code chunk below extracts and marks attractors in the data.
# Get number of maximally connected node
emadata_nested_wrangled_both_recnets_nodes <- emadata_nested_wrangled_both_recnets %>%
dplyr::mutate(strongest_day = purrr::map(.x = graph_from_adjacency,
.f = ~which.max(igraph::strength(.x))
))
emadata_nested_wrangled_both_recnets_nodes <- emadata_nested_wrangled_both_recnets_nodes %>%
dplyr::mutate(list_of_edges = purrr::map(.x = graph_from_adjacency,
.f = ~igraph::get.data.frame(.x)
))
emadata_nested_wrangled_both_recnets_nodes <- emadata_nested_wrangled_both_recnets_nodes %>%
dplyr::mutate(all_nodes_with_strengths =
purrr::map2(.x = data_firstlast_divided_by_max,
.y = graph_from_adjacency,
.f = ~{
data.frame(.x,
strength = igraph::strength(.y)) %>%
dplyr::mutate(time = dplyr::row_number()) %>%
tidyr::pivot_longer(cols = c(-strength, -time))
}
))
# Extract nodes (i.e. times) which connect to the strongest (i.e. most connected) node
emadata_nested_wrangled_both_recnets_nodes <- emadata_nested_wrangled_both_recnets_nodes %>%
dplyr::mutate(connecting_to_strongest = purrr::map2(.x = list_of_edges,
.y = strongest_day,
.f = ~{
.x %>% dplyr::filter(from == .y | to == .y) %>%
dplyr::arrange(weight) %>%
tidyr::pivot_longer(cols = c(from, to),
values_to = "node") %>%
dplyr::distinct(node,
#.keep_all = TRUE
) %>%
dplyr::pull(node)
}
)
)
emadata_nested_wrangled_both_recnets_nodes <- emadata_nested_wrangled_both_recnets_nodes %>%
dplyr::mutate(all_nodes_with_strengths = purrr::map2(.x = all_nodes_with_strengths,
.y = connecting_to_strongest,
.f = ~{
dplyr::mutate(.x,
connecting_to_strongest =
dplyr::case_when(time %in% .y ~ TRUE,
TRUE ~ FALSE))
}
))
# Get number of 2nd maximally connected node, which doesn't connect to the 1st
emadata_nested_wrangled_both_recnets_nodes <- emadata_nested_wrangled_both_recnets_nodes %>%
dplyr::mutate(secondary_attractor_day = purrr::map2(.x = graph_from_adjacency,
.y = connecting_to_strongest,
.f = ~{
data.frame(strength = igraph::strength(.x),
time = 1:length(igraph::strength(.x))) %>%
dplyr::filter(!time %in% .y) %>%
dplyr::arrange(desc(strength)) %>%
dplyr::slice(1) %>%
dplyr::pull(time)
}
))
# Extract nodes (i.e. times) which connect to the 2nd strongest node, which doesn't connect to the 1st
emadata_nested_wrangled_both_recnets_nodes <- emadata_nested_wrangled_both_recnets_nodes %>%
dplyr::mutate(connecting_to_2nd_strongest = purrr::map2(.x = list_of_edges,
.y = secondary_attractor_day,
.f = ~{
.x %>% dplyr::filter(from == .y | to == .y) %>%
dplyr::arrange(weight) %>%
tidyr::pivot_longer(cols = c(from, to),
values_to = "node") %>%
dplyr::distinct(node,
#.keep_all = TRUE
) %>%
dplyr::pull(node)
}
)
)
# Save as a variable in the dataset
emadata_nested_wrangled_both_recnets_nodes <- emadata_nested_wrangled_both_recnets_nodes %>%
dplyr::mutate(all_nodes_with_strengths = purrr::map2(.x = all_nodes_with_strengths,
.y = connecting_to_2nd_strongest,
.f = ~{
dplyr::mutate(.x,
connecting_to_2nd_strongest =
dplyr::case_when(time %in% .y ~ TRUE,
TRUE ~ FALSE))
}
))
# Get number of 3rd maximally connected node, which doesn't connect to the 1st or second
emadata_nested_wrangled_both_recnets_nodes <- emadata_nested_wrangled_both_recnets_nodes %>%
dplyr::mutate(tertiary_attractor_day = purrr::pmap(list(..1 = graph_from_adjacency,
..2 = connecting_to_strongest,
..3 = connecting_to_2nd_strongest),
.f = ~{
data.frame(strength = igraph::strength(..1),
time = 1:length(igraph::strength(..1))) %>%
dplyr::filter(!time %in% ..2,
!time %in% ..3) %>%
dplyr::arrange(desc(strength)) %>%
dplyr::slice(1) %>%
dplyr::pull(time)
}
))
# Extract nodes (i.e. times) which connect to the 3rd strongest node
emadata_nested_wrangled_both_recnets_nodes <- emadata_nested_wrangled_both_recnets_nodes %>%
dplyr::mutate(connecting_to_3rd_strongest = purrr::map2(.x = list_of_edges,
.y = tertiary_attractor_day,
.f = ~{
.x %>% dplyr::filter(from == .y | to == .y) %>%
dplyr::arrange(weight) %>%
tidyr::pivot_longer(cols = c(from, to),
values_to = "node") %>%
dplyr::distinct(node,
#.keep_all = TRUE
) %>%
dplyr::pull(node)
}
)
)
# Save as a variable
emadata_nested_wrangled_both_recnets_nodes <- emadata_nested_wrangled_both_recnets_nodes %>%
dplyr::mutate(all_nodes_with_strengths = purrr::map2(.x = all_nodes_with_strengths,
.y = connecting_to_3rd_strongest,
.f = ~{
dplyr::mutate(.x,
connecting_to_3rd_strongest =
dplyr::case_when(time %in% .y ~ TRUE,
TRUE ~ FALSE))
}
))
# Get number of 4th maximally connected node, which doesn't connect to the 1st, 2nd, or 3rd
emadata_nested_wrangled_both_recnets_nodes <- emadata_nested_wrangled_both_recnets_nodes %>%
dplyr::mutate(fourth_attractor_day = purrr::pmap(list(..1 = graph_from_adjacency,
..2 = connecting_to_strongest,
..3 = connecting_to_2nd_strongest,
..4 = connecting_to_3rd_strongest),
.f = ~{
data.frame(strength = igraph::strength(..1),
time = 1:length(igraph::strength(..1))) %>%
dplyr::filter(!time %in% ..2,
!time %in% ..3,
!time %in% ..4) %>%
dplyr::arrange(desc(strength)) %>%
dplyr::slice(1) %>%
dplyr::pull(time)
}
))
# Extract nodes (i.e. times) which connect to the 4th strongest node
emadata_nested_wrangled_both_recnets_nodes <- emadata_nested_wrangled_both_recnets_nodes %>%
dplyr::mutate(connecting_to_4th_strongest = purrr::map2(.x = list_of_edges,
.y = fourth_attractor_day,
.f = ~{
.x %>% dplyr::filter(from == .y | to == .y) %>%
dplyr::arrange(weight) %>%
tidyr::pivot_longer(cols = c(from, to),
values_to = "node") %>%
dplyr::distinct(node,
#.keep_all = TRUE
) %>%
dplyr::pull(node)
}
)
)
# Save as a variable
emadata_nested_wrangled_both_recnets_nodes <- emadata_nested_wrangled_both_recnets_nodes %>%
dplyr::mutate(all_nodes_with_strengths = purrr::map2(.x = all_nodes_with_strengths,
.y = connecting_to_4th_strongest,
.f = ~{
dplyr::mutate(.x,
connecting_to_4th_strongest =
dplyr::case_when(time %in% .y ~ TRUE,
TRUE ~ FALSE))
}
))
################### Make plots
emadata_nested_wrangled_both_recnets_nodes_plots <- emadata_nested_wrangled_both_recnets_nodes %>%
dplyr::mutate(all_nodes_with_strengths =
purrr::map(.x = all_nodes_with_strengths,
.f = ~{
dplyr::mutate(.x,
attractors = dplyr::case_when(
strength == 0 ~ "Unique",
connecting_to_strongest == TRUE ~ "1st",
connecting_to_2nd_strongest == TRUE ~ "2nd",
connecting_to_3rd_strongest == TRUE ~ "3rd",
connecting_to_4th_strongest == TRUE ~ "4th",
TRUE ~ "Uncategorised"),
attractors = factor(attractors,
levels = c("1st",
"2nd",
"3rd",
"4th",
"Uncategorised",
"Unique")),
name = factor(name,
levels = c("pleasure",
"interest",
"importance",
"situation_requires",
"anxiety_guilt_avoidance",
"another_wants"),
labels = c("Pleasure",
"Interest",
"Importance",
"Situation requires",
"Anxiety guilt avoidance",
"Another wants")) %>%
forcats::fct_drop()) %>%
dplyr::group_by(attractors, name) %>%
dplyr::mutate(n = n()) %>%
dplyr::ungroup() %>%
dplyr::mutate(maxtime = max(time),
percentage_of_total =
(n / maxtime) %>% scales::percent(accuracy = 0.1),
proportion_of_total = n/maxtime,
attractors_n =
factor(paste0(attractors,
" (n = ", n, "; ",
percentage_of_total, ")")))
}
))Spiral graph with colored nodes
emadata_nested_wrangled_both_recnets_nodes_plots <- emadata_nested_wrangled_both_recnets_nodes_plots %>%
  dplyr::mutate(node_colors = purrr::map(.x = all_nodes_with_strengths,
                                         .f = ~{tidyr::pivot_wider(.x, names_from = name) %>%
                                             dplyr::pull(attractors)}))

for (i in 1:nrow(emadata_nested_wrangled_both_recnets_nodes_plots)) {
levels(emadata_nested_wrangled_both_recnets_nodes_plots$node_colors[[i]]) <-
  c(viridisLite::plasma(4,
                      end = 0.8,
                      direction = -1), "gray48", "white")
  }

emadata_nested_wrangled_both_recnets_nodes_plots <- emadata_nested_wrangled_both_recnets_nodes_plots %>%
  dplyr::mutate(spiralgraph_epochs = purrr::pmap(list(..1 = graph_from_adjacency,
                                          ..2 = node_colors,
                                          ..3 = User),
                                     .f =  ~casnet::make_spiral_graph(g = ..1,
                                                                      arcs = 4,
                                                                      # a = .1,
                                                                      # b = 2,
                                                                      markTimeBy = TRUE,
                                                                      markEpochsBy = ..2,
                                                                      epochColours = ..2,
                                                                      showEpochLegend = FALSE,
                                                                      scaleEdgeSize = 1/10,
                                                                      scaleVertexSize = c(1, 5),
                                                                      showSizeLegend = FALSE,
                                                                      sizeLabel = "Node strength",
                                                                      type = "Euler",
                                                                      # alphaE = 0.1
                                                                      # title = ..3
                                     )))
# emadata_nested_wrangled_both_recnets_nodes_plots$spiralgraph_epochs[[1]] +
#   theme(plot.margin=grid::unit(c(0,0,0,0), "mm"))

# ggsave(filename = "./figures/recnetwork.png",
#        width = 7,
#        height = 7)

# emadata_nested_wrangled_both_recnets_nodes_plots$all_nodes_with_strengths[[1]]
Attractor plot
emadata_nested_wrangled_both_recnets_nodes_plots <- emadata_nested_wrangled_both_recnets_nodes_plots %>%
  dplyr::mutate(observations = purrr::map_dbl(.x = data_firstlast_divided_by_max,
                                              .f = ~nrow(.)))

emadata_nested_wrangled_both_recnets_nodes_plots <- emadata_nested_wrangled_both_recnets_nodes_plots %>%
  dplyr::mutate(observations_daily = purrr::map_dbl(.x = data_daily,
                                              .f = ~nrow(.)))


emadata_nested_wrangled_both_recnets_nodes_plots <- emadata_nested_wrangled_both_recnets_nodes_plots %>%
  dplyr::mutate(
    attractor_plots =
      purrr::pmap(list(..1 = all_nodes_with_strengths,
                       ..2 = observations,
                       ..3 = observations_daily,
                       ..4 = User),
                  .f = ~{
                    dplyr::mutate(..1,
                                  strength_rescaled =
                                    scales::rescale(strength, to = c(0.3, 1.1)),
                                  alpha_strength = ifelse(strength_rescaled == 0.3,
                                                          0.5,
                                                          strength_rescaled)) %>%
                      ggplot(data = .,
                             aes(x = forcats::fct_rev(name),
                                 y = value,
                                 size = strength_rescaled,
                                 alpha = alpha_strength,
                                 color = attractors_n)) +
                      scale_size_identity() +
                      scale_alpha_identity() +
                      geom_point(aes(alpha = alpha_strength)) +
                      geom_line(aes(group = time,
                                    alpha = alpha_strength)) +
                      scale_color_manual(values = c(viridisLite::plasma(4,
                                                                        end = 0.8,
                                                                        direction = -1),
                                                    "gray40", "gray50")) +
                      scale_y_continuous(labels = scales::label_percent(accuracy = 1)) +
                      theme_bw() +
                      theme(legend.position = "none") +
                      labs(y = "Percentage of maximum reported value of variable, across full time series",
                           x = NULL,
                           title = paste0("Participant \"", ..4, "\" - based on ", ..2, " data points (", ..3, " days)"),
                           caption = paste0("Recurrence rate used for the analysis: ", scales::percent(recurrence_rate))) +
                      facet_wrap(~attractors_n) +
                      coord_flip(ylim = c(0, 1))
                  }
      ))

emadata_nested_wrangled_both_recnets_nodes_plots$attractor_plots[[1]]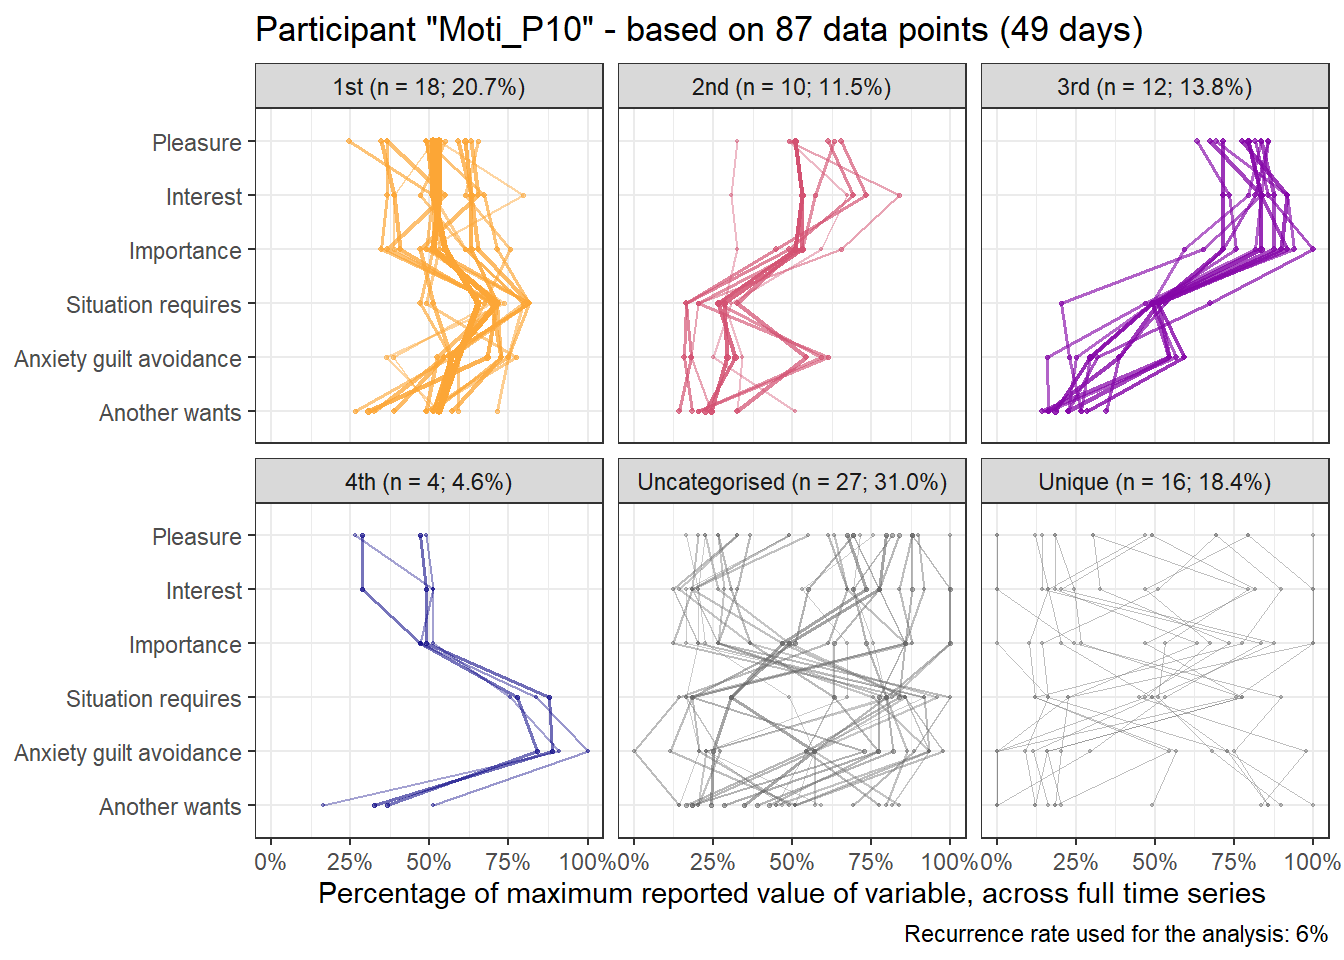
# emadata_nested_wrangled_both_recnets_nodes_plots$all_nodes_with_strengths[[1]]

# # Save this to be used for the task analysis later; otherwise overwritten by sensitivity analyses:
# firstlast_emadata_nested_wrangled_both_recnets_nodes_plots <-
#   emadata_nested_wrangled_both_recnets_nodes_plots

# cowplot::save_plot("./figures/attractors.png",
#                    emadata_nested_wrangled_both_recnets_nodes_plots$attractor_plots[[1]],
#                    dpi = 300,
#                    base_height = 11.69/2)
7%
Here’s the 6-dimensional motivation system’s recurrence plot, weighted by similarity.
recurrence_rate <- 0.07

set.seed(100)

#######################

# si = similarity under the radius
emadata_nested_wrangled_both_recnets <- emadata_nested_wrangled %>%
  dplyr::mutate(RN = purrr::map(.x = data_firstlast_divided_by_max,
                                .f =  ~casnet::rn(.x %>% dplyr::select(#autonomy, competence, relatedness,
                                                                       pleasure, interest, importance,
                                                                       situation_requires,
                                                                       anxiety_guilt_avoidance,
                                                                       another_wants),
                                                  doEmbed = FALSE,
                                                  weighted = TRUE,
                                                  weightedBy = "si",
                                                  emRad = NA,
                                                  targetValue = recurrence_rate)))
##
## Auto-recurrence: Setting diagonal to (1 + max. distance) for analyses
##
## Searching for a radius that will yield 0.07 for RR

emadata_nested_wrangled_both_recnets <- emadata_nested_wrangled_both_recnets %>%
  dplyr::mutate(graph_from_adjacency = purrr::map(.x = RN,
                                                  .f = ~igraph::graph_from_adjacency_matrix(.x,
                                                                                            weighted = TRUE,
                                                                                            mode = "upper",
                                                                                            diag = FALSE)))

# Edges with their distances
emadata_nested_wrangled_both_recnets <- emadata_nested_wrangled_both_recnets %>%
  dplyr::mutate(edges_with_distances = purrr::map(.x = graph_from_adjacency,
                                                  .f = ~igraph::E(.x)$weight),
                graph_from_adjacency_orig = graph_from_adjacency)

# Larger values are closer to the state; inverse of weight makes it more intuitive
for (i in 1:nrow(emadata_nested_wrangled_both_recnets)) {
igraph::E(emadata_nested_wrangled_both_recnets$graph_from_adjacency[[i]])$weight <- (1/emadata_nested_wrangled_both_recnets$edges_with_distances[[i]])
}
# A later note to self: Now weight is a measure of distance; how far apart two time points are
# (under the radius, i.e. they're reasonably similar to begin with)

####### To check:
# igraph::E(emadata_nested_wrangled_both_recnets$graph_from_adjacency[[1]])$weight
# igraph::E(emadata_nested_wrangled_both_recnets$graph_from_adjacency_orig[[1]])$weight

emadata_nested_wrangled_both_recnets <- emadata_nested_wrangled_both_recnets %>%
  dplyr::mutate(RN_plot = purrr::map(.x = RN,
                                .f =  ~casnet::rn_plot(.x,
                                                       plotDimensions = TRUE,
                                                       xlab = "6-dimensional motivation system",
                                                       ylab = "6-dimensional motivation system")))
# Make node size equal to strength. Strength is the sum of a node's edge weights.
for (i in 1:nrow(emadata_nested_wrangled_both_recnets)) {
igraph::V(emadata_nested_wrangled_both_recnets$graph_from_adjacency[[i]])$size <- (igraph::strength(emadata_nested_wrangled_both_recnets$graph_from_adjacency[[i]]))
}

# Rescaling weight as "width"; varies between 5 and 10
for (i in 1:nrow(emadata_nested_wrangled_both_recnets)) {
igraph::E(emadata_nested_wrangled_both_recnets$graph_from_adjacency[[i]])$width <-
  casnet::elascer(igraph::E(emadata_nested_wrangled_both_recnets$graph_from_adjacency[[i]])$weight, lo = 5, hi = 10)
}
The lengthy code chunk below extracts and marks attractors in the data.
# Get number of maximally connected node
emadata_nested_wrangled_both_recnets_nodes <- emadata_nested_wrangled_both_recnets %>%
dplyr::mutate(strongest_day = purrr::map(.x = graph_from_adjacency,
.f = ~which.max(igraph::strength(.x))
))
emadata_nested_wrangled_both_recnets_nodes <- emadata_nested_wrangled_both_recnets_nodes %>%
dplyr::mutate(list_of_edges = purrr::map(.x = graph_from_adjacency,
.f = ~igraph::get.data.frame(.x)
))
emadata_nested_wrangled_both_recnets_nodes <- emadata_nested_wrangled_both_recnets_nodes %>%
dplyr::mutate(all_nodes_with_strengths =
purrr::map2(.x = data_firstlast_divided_by_max,
.y = graph_from_adjacency,
.f = ~{
data.frame(.x,
strength = igraph::strength(.y)) %>%
dplyr::mutate(time = dplyr::row_number()) %>%
tidyr::pivot_longer(cols = c(-strength, -time))
}
))
# Extract nodes (i.e. times) which connect to the strongest (i.e. most connected) node
emadata_nested_wrangled_both_recnets_nodes <- emadata_nested_wrangled_both_recnets_nodes %>%
dplyr::mutate(connecting_to_strongest = purrr::map2(.x = list_of_edges,
.y = strongest_day,
.f = ~{
.x %>% dplyr::filter(from == .y | to == .y) %>%
dplyr::arrange(weight) %>%
tidyr::pivot_longer(cols = c(from, to),
values_to = "node") %>%
dplyr::distinct(node,
#.keep_all = TRUE
) %>%
dplyr::pull(node)
}
)
)
emadata_nested_wrangled_both_recnets_nodes <- emadata_nested_wrangled_both_recnets_nodes %>%
dplyr::mutate(all_nodes_with_strengths = purrr::map2(.x = all_nodes_with_strengths,
.y = connecting_to_strongest,
.f = ~{
dplyr::mutate(.x,
connecting_to_strongest =
dplyr::case_when(time %in% .y ~ TRUE,
TRUE ~ FALSE))
}
))
# Get number of 2nd maximally connected node, which doesn't connect to the 1st
emadata_nested_wrangled_both_recnets_nodes <- emadata_nested_wrangled_both_recnets_nodes %>%
dplyr::mutate(secondary_attractor_day = purrr::map2(.x = graph_from_adjacency,
.y = connecting_to_strongest,
.f = ~{
data.frame(strength = igraph::strength(.x),
time = 1:length(igraph::strength(.x))) %>%
dplyr::filter(!time %in% .y) %>%
dplyr::arrange(desc(strength)) %>%
dplyr::slice(1) %>%
dplyr::pull(time)
}
))
# Extract nodes (i.e. times) which connect to the 2nd strongest node, which doesn't connect to the 1st
emadata_nested_wrangled_both_recnets_nodes <- emadata_nested_wrangled_both_recnets_nodes %>%
dplyr::mutate(connecting_to_2nd_strongest = purrr::map2(.x = list_of_edges,
.y = secondary_attractor_day,
.f = ~{
.x %>% dplyr::filter(from == .y | to == .y) %>%
dplyr::arrange(weight) %>%
tidyr::pivot_longer(cols = c(from, to),
values_to = "node") %>%
dplyr::distinct(node,
#.keep_all = TRUE
) %>%
dplyr::pull(node)
}
)
)
# Save as a variable in the dataset
emadata_nested_wrangled_both_recnets_nodes <- emadata_nested_wrangled_both_recnets_nodes %>%
dplyr::mutate(all_nodes_with_strengths = purrr::map2(.x = all_nodes_with_strengths,
.y = connecting_to_2nd_strongest,
.f = ~{
dplyr::mutate(.x,
connecting_to_2nd_strongest =
dplyr::case_when(time %in% .y ~ TRUE,
TRUE ~ FALSE))
}
))
# Get number of 3rd maximally connected node, which doesn't connect to the 1st or second
emadata_nested_wrangled_both_recnets_nodes <- emadata_nested_wrangled_both_recnets_nodes %>%
dplyr::mutate(tertiary_attractor_day = purrr::pmap(list(..1 = graph_from_adjacency,
..2 = connecting_to_strongest,
..3 = connecting_to_2nd_strongest),
.f = ~{
data.frame(strength = igraph::strength(..1),
time = 1:length(igraph::strength(..1))) %>%
dplyr::filter(!time %in% ..2,
!time %in% ..3) %>%
dplyr::arrange(desc(strength)) %>%
dplyr::slice(1) %>%
dplyr::pull(time)
}
))
# Extract nodes (i.e. times) which connect to the 3rd strongest node
emadata_nested_wrangled_both_recnets_nodes <- emadata_nested_wrangled_both_recnets_nodes %>%
dplyr::mutate(connecting_to_3rd_strongest = purrr::map2(.x = list_of_edges,
.y = tertiary_attractor_day,
.f = ~{
.x %>% dplyr::filter(from == .y | to == .y) %>%
dplyr::arrange(weight) %>%
tidyr::pivot_longer(cols = c(from, to),
values_to = "node") %>%
dplyr::distinct(node,
#.keep_all = TRUE
) %>%
dplyr::pull(node)
}
)
)
# Save as a variable
emadata_nested_wrangled_both_recnets_nodes <- emadata_nested_wrangled_both_recnets_nodes %>%
dplyr::mutate(all_nodes_with_strengths = purrr::map2(.x = all_nodes_with_strengths,
.y = connecting_to_3rd_strongest,
.f = ~{
dplyr::mutate(.x,
connecting_to_3rd_strongest =
dplyr::case_when(time %in% .y ~ TRUE,
TRUE ~ FALSE))
}
))
# Get number of 4th maximally connected node, which doesn't connect to the 1st, 2nd, or 3rd
emadata_nested_wrangled_both_recnets_nodes <- emadata_nested_wrangled_both_recnets_nodes %>%
dplyr::mutate(fourth_attractor_day = purrr::pmap(list(..1 = graph_from_adjacency,
..2 = connecting_to_strongest,
..3 = connecting_to_2nd_strongest,
..4 = connecting_to_3rd_strongest),
.f = ~{
data.frame(strength = igraph::strength(..1),
time = 1:length(igraph::strength(..1))) %>%
dplyr::filter(!time %in% ..2,
!time %in% ..3,
!time %in% ..4) %>%
dplyr::arrange(desc(strength)) %>%
dplyr::slice(1) %>%
dplyr::pull(time)
}
))
# Extract nodes (i.e. times) which connect to the 4th strongest node
emadata_nested_wrangled_both_recnets_nodes <- emadata_nested_wrangled_both_recnets_nodes %>%
dplyr::mutate(connecting_to_4th_strongest = purrr::map2(.x = list_of_edges,
.y = fourth_attractor_day,
.f = ~{
.x %>% dplyr::filter(from == .y | to == .y) %>%
dplyr::arrange(weight) %>%
tidyr::pivot_longer(cols = c(from, to),
values_to = "node") %>%
dplyr::distinct(node,
#.keep_all = TRUE
) %>%
dplyr::pull(node)
}
)
)
# Save as a variable
emadata_nested_wrangled_both_recnets_nodes <- emadata_nested_wrangled_both_recnets_nodes %>%
dplyr::mutate(all_nodes_with_strengths = purrr::map2(.x = all_nodes_with_strengths,
.y = connecting_to_4th_strongest,
.f = ~{
dplyr::mutate(.x,
connecting_to_4th_strongest =
dplyr::case_when(time %in% .y ~ TRUE,
TRUE ~ FALSE))
}
))
################### Make plots
emadata_nested_wrangled_both_recnets_nodes_plots <- emadata_nested_wrangled_both_recnets_nodes %>%
dplyr::mutate(all_nodes_with_strengths =
purrr::map(.x = all_nodes_with_strengths,
.f = ~{
dplyr::mutate(.x,
attractors = dplyr::case_when(
strength == 0 ~ "Unique",
connecting_to_strongest == TRUE ~ "1st",
connecting_to_2nd_strongest == TRUE ~ "2nd",
connecting_to_3rd_strongest == TRUE ~ "3rd",
connecting_to_4th_strongest == TRUE ~ "4th",
TRUE ~ "Uncategorised"),
attractors = factor(attractors,
levels = c("1st",
"2nd",
"3rd",
"4th",
"Uncategorised",
"Unique")),
name = factor(name,
levels = c("pleasure",
"interest",
"importance",
"situation_requires",
"anxiety_guilt_avoidance",
"another_wants"),
labels = c("Pleasure",
"Interest",
"Importance",
"Situation requires",
"Anxiety guilt avoidance",
"Another wants")) %>%
forcats::fct_drop()) %>%
dplyr::group_by(attractors, name) %>%
dplyr::mutate(n = n()) %>%
dplyr::ungroup() %>%
dplyr::mutate(maxtime = max(time),
percentage_of_total =
(n / maxtime) %>% scales::percent(accuracy = 0.1),
proportion_of_total = n/maxtime,
attractors_n =
factor(paste0(attractors,
" (n = ", n, "; ",
percentage_of_total, ")")))
}
))Spiral graph with colored nodes
emadata_nested_wrangled_both_recnets_nodes_plots <- emadata_nested_wrangled_both_recnets_nodes_plots %>%
  dplyr::mutate(node_colors = purrr::map(.x = all_nodes_with_strengths,
                                         .f = ~{tidyr::pivot_wider(.x, names_from = name) %>%
                                             dplyr::pull(attractors)}))

for (i in 1:nrow(emadata_nested_wrangled_both_recnets_nodes_plots)) {
levels(emadata_nested_wrangled_both_recnets_nodes_plots$node_colors[[i]]) <-
  c(viridisLite::plasma(4,
                      end = 0.8,
                      direction = -1), "gray48", "white")
  }

emadata_nested_wrangled_both_recnets_nodes_plots <- emadata_nested_wrangled_both_recnets_nodes_plots %>%
  dplyr::mutate(spiralgraph_epochs = purrr::pmap(list(..1 = graph_from_adjacency,
                                          ..2 = node_colors,
                                          ..3 = User),
                                     .f =  ~casnet::make_spiral_graph(g = ..1,
                                                                      arcs = 4,
                                                                      # a = .1,
                                                                      # b = 2,
                                                                      markTimeBy = TRUE,
                                                                      markEpochsBy = ..2,
                                                                      epochColours = ..2,
                                                                      showEpochLegend = FALSE,
                                                                      scaleEdgeSize = 1/10,
                                                                      scaleVertexSize = c(1, 5),
                                                                      showSizeLegend = FALSE,
                                                                      sizeLabel = "Node strength",
                                                                      type = "Euler",
                                                                      # alphaE = 0.1
                                                                      # title = ..3
                                     )))
# emadata_nested_wrangled_both_recnets_nodes_plots$spiralgraph_epochs[[1]] +
#   theme(plot.margin=grid::unit(c(0,0,0,0), "mm"))

# ggsave(filename = "./figures/recnetwork.png",
#        width = 7,
#        height = 7)

# emadata_nested_wrangled_both_recnets_nodes_plots$all_nodes_with_strengths[[1]]
Attractor plot
emadata_nested_wrangled_both_recnets_nodes_plots <- emadata_nested_wrangled_both_recnets_nodes_plots %>%
  dplyr::mutate(observations = purrr::map_dbl(.x = data_firstlast_divided_by_max,
                                              .f = ~nrow(.)))

emadata_nested_wrangled_both_recnets_nodes_plots <- emadata_nested_wrangled_both_recnets_nodes_plots %>%
  dplyr::mutate(observations_daily = purrr::map_dbl(.x = data_daily,
                                              .f = ~nrow(.)))


emadata_nested_wrangled_both_recnets_nodes_plots <- emadata_nested_wrangled_both_recnets_nodes_plots %>%
  dplyr::mutate(
    attractor_plots =
      purrr::pmap(list(..1 = all_nodes_with_strengths,
                       ..2 = observations,
                       ..3 = observations_daily,
                       ..4 = User),
                  .f = ~{
                    dplyr::mutate(..1,
                                  strength_rescaled =
                                    scales::rescale(strength, to = c(0.3, 1.1)),
                                  alpha_strength = ifelse(strength_rescaled == 0.3,
                                                          0.5,
                                                          strength_rescaled)) %>%
                      ggplot(data = .,
                             aes(x = forcats::fct_rev(name),
                                 y = value,
                                 size = strength_rescaled,
                                 alpha = alpha_strength,
                                 color = attractors_n)) +
                      scale_size_identity() +
                      scale_alpha_identity() +
                      geom_point(aes(alpha = alpha_strength)) +
                      geom_line(aes(group = time,
                                    alpha = alpha_strength)) +
                      scale_color_manual(values = c(viridisLite::plasma(4,
                                                                        end = 0.8,
                                                                        direction = -1),
                                                    "gray40", "gray50")) +
                      scale_y_continuous(labels = scales::label_percent(accuracy = 1)) +
                      theme_bw() +
                      theme(legend.position = "none") +
                      labs(y = "Percentage of maximum reported value of variable, across full time series",
                           x = NULL,
                           title = paste0("Participant \"", ..4, "\" - based on ", ..2, " data points (", ..3, " days)"),
                           caption = paste0("Recurrence rate used for the analysis: ", scales::percent(recurrence_rate))) +
                      facet_wrap(~attractors_n) +
                      coord_flip(ylim = c(0, 1))
                  }
      ))

emadata_nested_wrangled_both_recnets_nodes_plots$attractor_plots[[1]]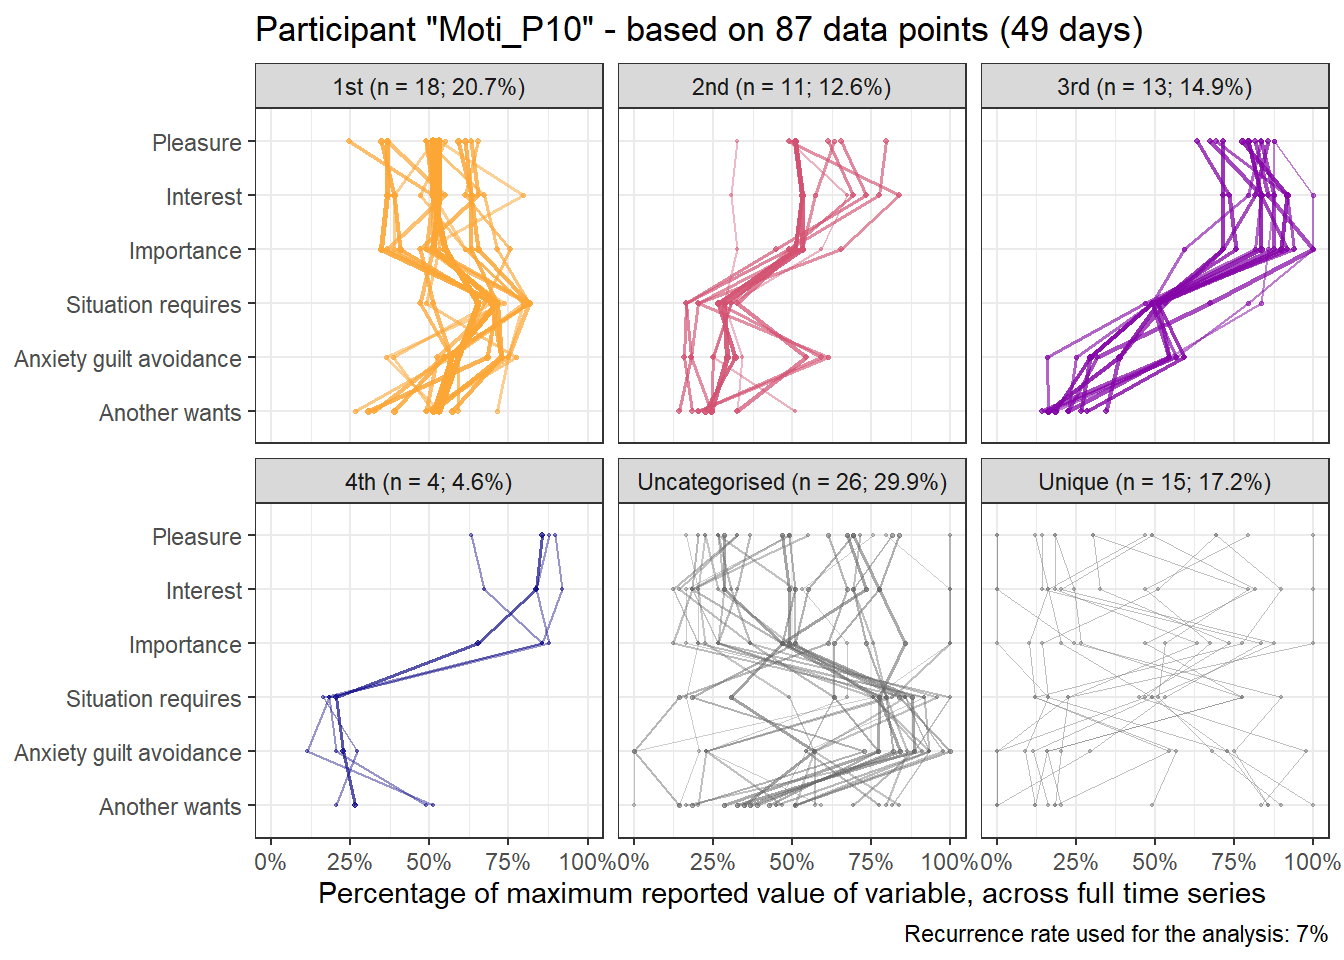
# emadata_nested_wrangled_both_recnets_nodes_plots$all_nodes_with_strengths[[1]]

# # Save this to be used for the task analysis later; otherwise overwritten by sensitivity analyses:
# firstlast_emadata_nested_wrangled_both_recnets_nodes_plots <-
#   emadata_nested_wrangled_both_recnets_nodes_plots

# cowplot::save_plot("./figures/attractors.png",
#                    emadata_nested_wrangled_both_recnets_nodes_plots$attractor_plots[[1]],
#                    dpi = 300,
#                    base_height = 11.69/2)
8%
Here’s the 6-dimensional motivation system’s recurrence plot, weighted by similarity.
recurrence_rate <- 0.08

set.seed(100)

#######################

# si = similarity under the radius
emadata_nested_wrangled_both_recnets <- emadata_nested_wrangled %>%
  dplyr::mutate(RN = purrr::map(.x = data_firstlast_divided_by_max,
                                .f =  ~casnet::rn(.x %>% dplyr::select(#autonomy, competence, relatedness,
                                                                       pleasure, interest, importance,
                                                                       situation_requires,
                                                                       anxiety_guilt_avoidance,
                                                                       another_wants),
                                                  doEmbed = FALSE,
                                                  weighted = TRUE,
                                                  weightedBy = "si",
                                                  emRad = NA,
                                                  targetValue = recurrence_rate)))
##
## Auto-recurrence: Setting diagonal to (1 + max. distance) for analyses
##
## Searching for a radius that will yield 0.08 for RR

emadata_nested_wrangled_both_recnets <- emadata_nested_wrangled_both_recnets %>%
  dplyr::mutate(graph_from_adjacency = purrr::map(.x = RN,
                                                  .f = ~igraph::graph_from_adjacency_matrix(.x,
                                                                                            weighted = TRUE,
                                                                                            mode = "upper",
                                                                                            diag = FALSE)))

# Edges with their distances
emadata_nested_wrangled_both_recnets <- emadata_nested_wrangled_both_recnets %>%
  dplyr::mutate(edges_with_distances = purrr::map(.x = graph_from_adjacency,
                                                  .f = ~igraph::E(.x)$weight),
                graph_from_adjacency_orig = graph_from_adjacency)

# Larger values are closer to the state; inverse of weight makes it more intuitive
for (i in 1:nrow(emadata_nested_wrangled_both_recnets)) {
igraph::E(emadata_nested_wrangled_both_recnets$graph_from_adjacency[[i]])$weight <- (1/emadata_nested_wrangled_both_recnets$edges_with_distances[[i]])
}
# A later note to self: Now weight is a measure of distance; how far apart two time points are
# (under the radius, i.e. they're reasonably similar to begin with)

####### To check:
# igraph::E(emadata_nested_wrangled_both_recnets$graph_from_adjacency[[1]])$weight
# igraph::E(emadata_nested_wrangled_both_recnets$graph_from_adjacency_orig[[1]])$weight

emadata_nested_wrangled_both_recnets <- emadata_nested_wrangled_both_recnets %>%
  dplyr::mutate(RN_plot = purrr::map(.x = RN,
                                .f =  ~casnet::rn_plot(.x,
                                                       plotDimensions = TRUE,
                                                       xlab = "6-dimensional motivation system",
                                                       ylab = "6-dimensional motivation system")))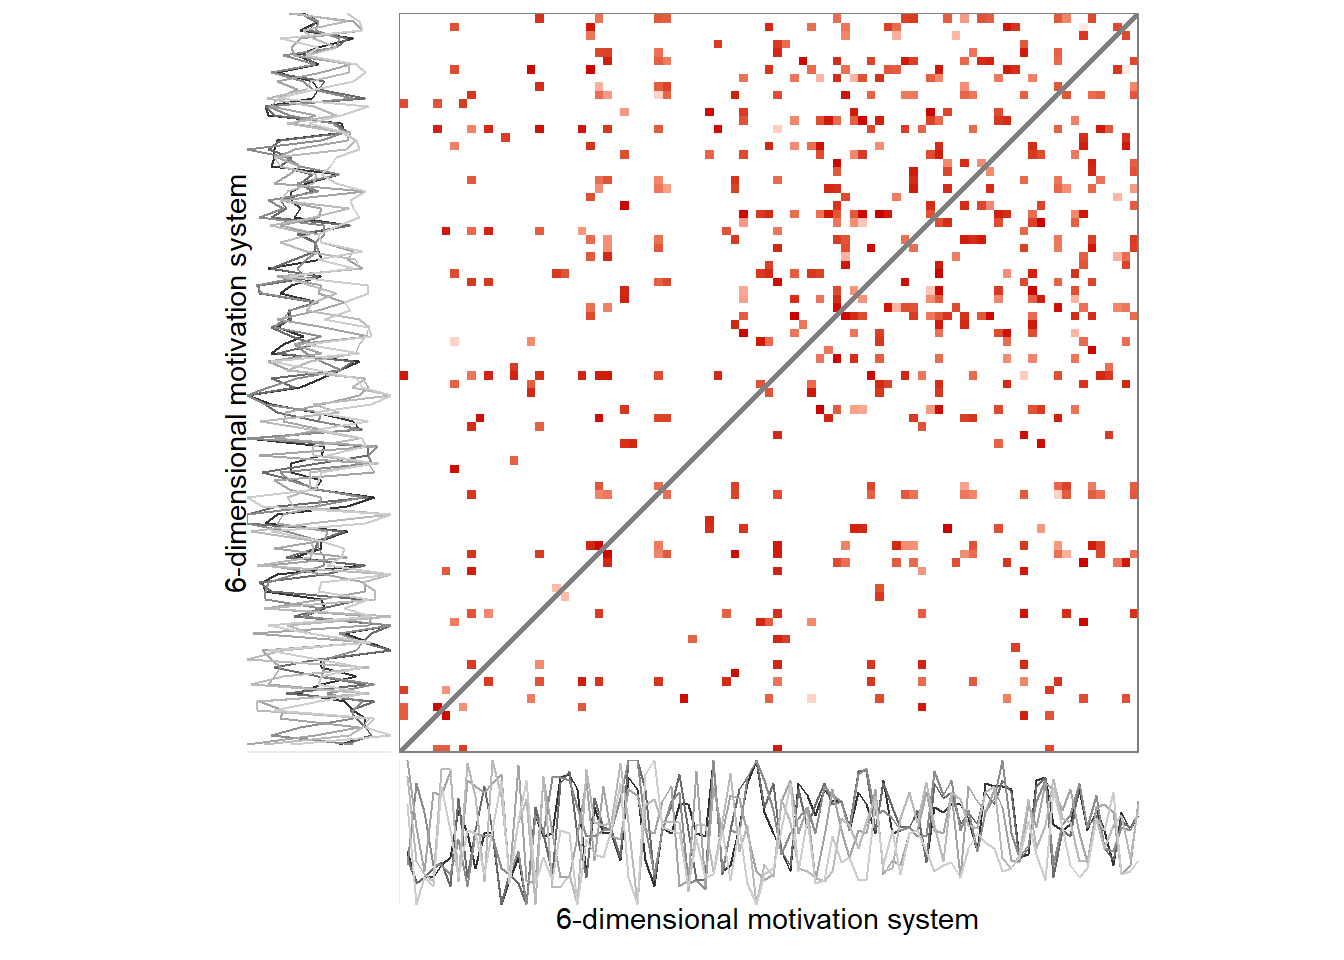
# Make node size equal to strength. Strength is the sum of a node's edge weights.
for (i in 1:nrow(emadata_nested_wrangled_both_recnets)) {
igraph::V(emadata_nested_wrangled_both_recnets$graph_from_adjacency[[i]])$size <- (igraph::strength(emadata_nested_wrangled_both_recnets$graph_from_adjacency[[i]]))
}

# Rescaling weight as "width"; varies between 5 and 10
for (i in 1:nrow(emadata_nested_wrangled_both_recnets)) {
igraph::E(emadata_nested_wrangled_both_recnets$graph_from_adjacency[[i]])$width <-
  casnet::elascer(igraph::E(emadata_nested_wrangled_both_recnets$graph_from_adjacency[[i]])$weight, lo = 5, hi = 10)
}
The lengthy code chunk below extracts and marks attractors in the data.
# Get number of maximally connected node
emadata_nested_wrangled_both_recnets_nodes <- emadata_nested_wrangled_both_recnets %>%
dplyr::mutate(strongest_day = purrr::map(.x = graph_from_adjacency,
.f = ~which.max(igraph::strength(.x))
))
emadata_nested_wrangled_both_recnets_nodes <- emadata_nested_wrangled_both_recnets_nodes %>%
dplyr::mutate(list_of_edges = purrr::map(.x = graph_from_adjacency,
.f = ~igraph::get.data.frame(.x)
))
emadata_nested_wrangled_both_recnets_nodes <- emadata_nested_wrangled_both_recnets_nodes %>%
dplyr::mutate(all_nodes_with_strengths =
purrr::map2(.x = data_firstlast_divided_by_max,
.y = graph_from_adjacency,
.f = ~{
data.frame(.x,
strength = igraph::strength(.y)) %>%
dplyr::mutate(time = dplyr::row_number()) %>%
tidyr::pivot_longer(cols = c(-strength, -time))
}
))
# Extract nodes (i.e. times) which connect to the strongest (i.e. most connected) node
emadata_nested_wrangled_both_recnets_nodes <- emadata_nested_wrangled_both_recnets_nodes %>%
dplyr::mutate(connecting_to_strongest = purrr::map2(.x = list_of_edges,
.y = strongest_day,
.f = ~{
.x %>% dplyr::filter(from == .y | to == .y) %>%
dplyr::arrange(weight) %>%
tidyr::pivot_longer(cols = c(from, to),
values_to = "node") %>%
dplyr::distinct(node,
#.keep_all = TRUE
) %>%
dplyr::pull(node)
}
)
)
emadata_nested_wrangled_both_recnets_nodes <- emadata_nested_wrangled_both_recnets_nodes %>%
dplyr::mutate(all_nodes_with_strengths = purrr::map2(.x = all_nodes_with_strengths,
.y = connecting_to_strongest,
.f = ~{
dplyr::mutate(.x,
connecting_to_strongest =
dplyr::case_when(time %in% .y ~ TRUE,
TRUE ~ FALSE))
}
))
# Get number of 2nd maximally connected node, which doesn't connect to the 1st
emadata_nested_wrangled_both_recnets_nodes <- emadata_nested_wrangled_both_recnets_nodes %>%
dplyr::mutate(secondary_attractor_day = purrr::map2(.x = graph_from_adjacency,
.y = connecting_to_strongest,
.f = ~{
data.frame(strength = igraph::strength(.x),
time = 1:length(igraph::strength(.x))) %>%
dplyr::filter(!time %in% .y) %>%
dplyr::arrange(desc(strength)) %>%
dplyr::slice(1) %>%
dplyr::pull(time)
}
))
# Extract nodes (i.e. times) which connect to the 2nd strongest node, which doesn't connect to the 1st
emadata_nested_wrangled_both_recnets_nodes <- emadata_nested_wrangled_both_recnets_nodes %>%
dplyr::mutate(connecting_to_2nd_strongest = purrr::map2(.x = list_of_edges,
.y = secondary_attractor_day,
.f = ~{
.x %>% dplyr::filter(from == .y | to == .y) %>%
dplyr::arrange(weight) %>%
tidyr::pivot_longer(cols = c(from, to),
values_to = "node") %>%
dplyr::distinct(node,
#.keep_all = TRUE
) %>%
dplyr::pull(node)
}
)
)
# Save as a variable in the dataset
emadata_nested_wrangled_both_recnets_nodes <- emadata_nested_wrangled_both_recnets_nodes %>%
dplyr::mutate(all_nodes_with_strengths = purrr::map2(.x = all_nodes_with_strengths,
.y = connecting_to_2nd_strongest,
.f = ~{
dplyr::mutate(.x,
connecting_to_2nd_strongest =
dplyr::case_when(time %in% .y ~ TRUE,
TRUE ~ FALSE))
}
))
# Get number of 3rd maximally connected node, which doesn't connect to the 1st or second
emadata_nested_wrangled_both_recnets_nodes <- emadata_nested_wrangled_both_recnets_nodes %>%
dplyr::mutate(tertiary_attractor_day = purrr::pmap(list(..1 = graph_from_adjacency,
..2 = connecting_to_strongest,
..3 = connecting_to_2nd_strongest),
.f = ~{
data.frame(strength = igraph::strength(..1),
time = 1:length(igraph::strength(..1))) %>%
dplyr::filter(!time %in% ..2,
!time %in% ..3) %>%
dplyr::arrange(desc(strength)) %>%
dplyr::slice(1) %>%
dplyr::pull(time)
}
))
# Extract nodes (i.e. times) which connect to the 3rd strongest node
emadata_nested_wrangled_both_recnets_nodes <- emadata_nested_wrangled_both_recnets_nodes %>%
dplyr::mutate(connecting_to_3rd_strongest = purrr::map2(.x = list_of_edges,
.y = tertiary_attractor_day,
.f = ~{
.x %>% dplyr::filter(from == .y | to == .y) %>%
dplyr::arrange(weight) %>%
tidyr::pivot_longer(cols = c(from, to),
values_to = "node") %>%
dplyr::distinct(node,
#.keep_all = TRUE
) %>%
dplyr::pull(node)
}
)
)
# Save as a variable
emadata_nested_wrangled_both_recnets_nodes <- emadata_nested_wrangled_both_recnets_nodes %>%
dplyr::mutate(all_nodes_with_strengths = purrr::map2(.x = all_nodes_with_strengths,
.y = connecting_to_3rd_strongest,
.f = ~{
dplyr::mutate(.x,
connecting_to_3rd_strongest =
dplyr::case_when(time %in% .y ~ TRUE,
TRUE ~ FALSE))
}
))
# Get number of 4th maximally connected node, which doesn't connect to the 1st, 2nd, or 3rd
emadata_nested_wrangled_both_recnets_nodes <- emadata_nested_wrangled_both_recnets_nodes %>%
dplyr::mutate(fourth_attractor_day = purrr::pmap(list(..1 = graph_from_adjacency,
..2 = connecting_to_strongest,
..3 = connecting_to_2nd_strongest,
..4 = connecting_to_3rd_strongest),
.f = ~{
data.frame(strength = igraph::strength(..1),
time = 1:length(igraph::strength(..1))) %>%
dplyr::filter(!time %in% ..2,
!time %in% ..3,
!time %in% ..4) %>%
dplyr::arrange(desc(strength)) %>%
dplyr::slice(1) %>%
dplyr::pull(time)
}
))
# Extract nodes (i.e. times) which connect to the 4th strongest node
emadata_nested_wrangled_both_recnets_nodes <- emadata_nested_wrangled_both_recnets_nodes %>%
dplyr::mutate(connecting_to_4th_strongest = purrr::map2(.x = list_of_edges,
.y = fourth_attractor_day,
.f = ~{
.x %>% dplyr::filter(from == .y | to == .y) %>%
dplyr::arrange(weight) %>%
tidyr::pivot_longer(cols = c(from, to),
values_to = "node") %>%
dplyr::distinct(node,
#.keep_all = TRUE
) %>%
dplyr::pull(node)
}
)
)
# Save as a variable
emadata_nested_wrangled_both_recnets_nodes <- emadata_nested_wrangled_both_recnets_nodes %>%
dplyr::mutate(all_nodes_with_strengths = purrr::map2(.x = all_nodes_with_strengths,
.y = connecting_to_4th_strongest,
.f = ~{
dplyr::mutate(.x,
connecting_to_4th_strongest =
dplyr::case_when(time %in% .y ~ TRUE,
TRUE ~ FALSE))
}
))
################### Make plots
emadata_nested_wrangled_both_recnets_nodes_plots <- emadata_nested_wrangled_both_recnets_nodes %>%
dplyr::mutate(all_nodes_with_strengths =
purrr::map(.x = all_nodes_with_strengths,
.f = ~{
dplyr::mutate(.x,
attractors = dplyr::case_when(
strength == 0 ~ "Unique",
connecting_to_strongest == TRUE ~ "1st",
connecting_to_2nd_strongest == TRUE ~ "2nd",
connecting_to_3rd_strongest == TRUE ~ "3rd",
connecting_to_4th_strongest == TRUE ~ "4th",
TRUE ~ "Uncategorised"),
attractors = factor(attractors,
levels = c("1st",
"2nd",
"3rd",
"4th",
"Uncategorised",
"Unique")),
name = factor(name,
levels = c("pleasure",
"interest",
"importance",
"situation_requires",
"anxiety_guilt_avoidance",
"another_wants"),
labels = c("Pleasure",
"Interest",
"Importance",
"Situation requires",
"Anxiety guilt avoidance",
"Another wants")) %>%
forcats::fct_drop()) %>%
dplyr::group_by(attractors, name) %>%
dplyr::mutate(n = n()) %>%
dplyr::ungroup() %>%
dplyr::mutate(maxtime = max(time),
percentage_of_total =
(n / maxtime) %>% scales::percent(accuracy = 0.1),
proportion_of_total = n/maxtime,
attractors_n =
factor(paste0(attractors,
" (n = ", n, "; ",
percentage_of_total, ")")))
}
))Spiral graph with colored nodes
emadata_nested_wrangled_both_recnets_nodes_plots <- emadata_nested_wrangled_both_recnets_nodes_plots %>%
  dplyr::mutate(node_colors = purrr::map(.x = all_nodes_with_strengths,
                                         .f = ~{tidyr::pivot_wider(.x, names_from = name) %>%
                                             dplyr::pull(attractors)}))

for (i in 1:nrow(emadata_nested_wrangled_both_recnets_nodes_plots)) {
levels(emadata_nested_wrangled_both_recnets_nodes_plots$node_colors[[i]]) <-
  c(viridisLite::plasma(4,
                      end = 0.8,
                      direction = -1), "gray48", "white")
  }

emadata_nested_wrangled_both_recnets_nodes_plots <- emadata_nested_wrangled_both_recnets_nodes_plots %>%
  dplyr::mutate(spiralgraph_epochs = purrr::pmap(list(..1 = graph_from_adjacency,
                                          ..2 = node_colors,
                                          ..3 = User),
                                     .f =  ~casnet::make_spiral_graph(g = ..1,
                                                                      arcs = 4,
                                                                      # a = .1,
                                                                      # b = 2,
                                                                      markTimeBy = TRUE,
                                                                      markEpochsBy = ..2,
                                                                      epochColours = ..2,
                                                                      showEpochLegend = FALSE,
                                                                      scaleEdgeSize = 1/10,
                                                                      scaleVertexSize = c(1, 5),
                                                                      showSizeLegend = FALSE,
                                                                      sizeLabel = "Node strength",
                                                                      type = "Euler",
                                                                      # alphaE = 0.1
                                                                      # title = ..3
                                     )))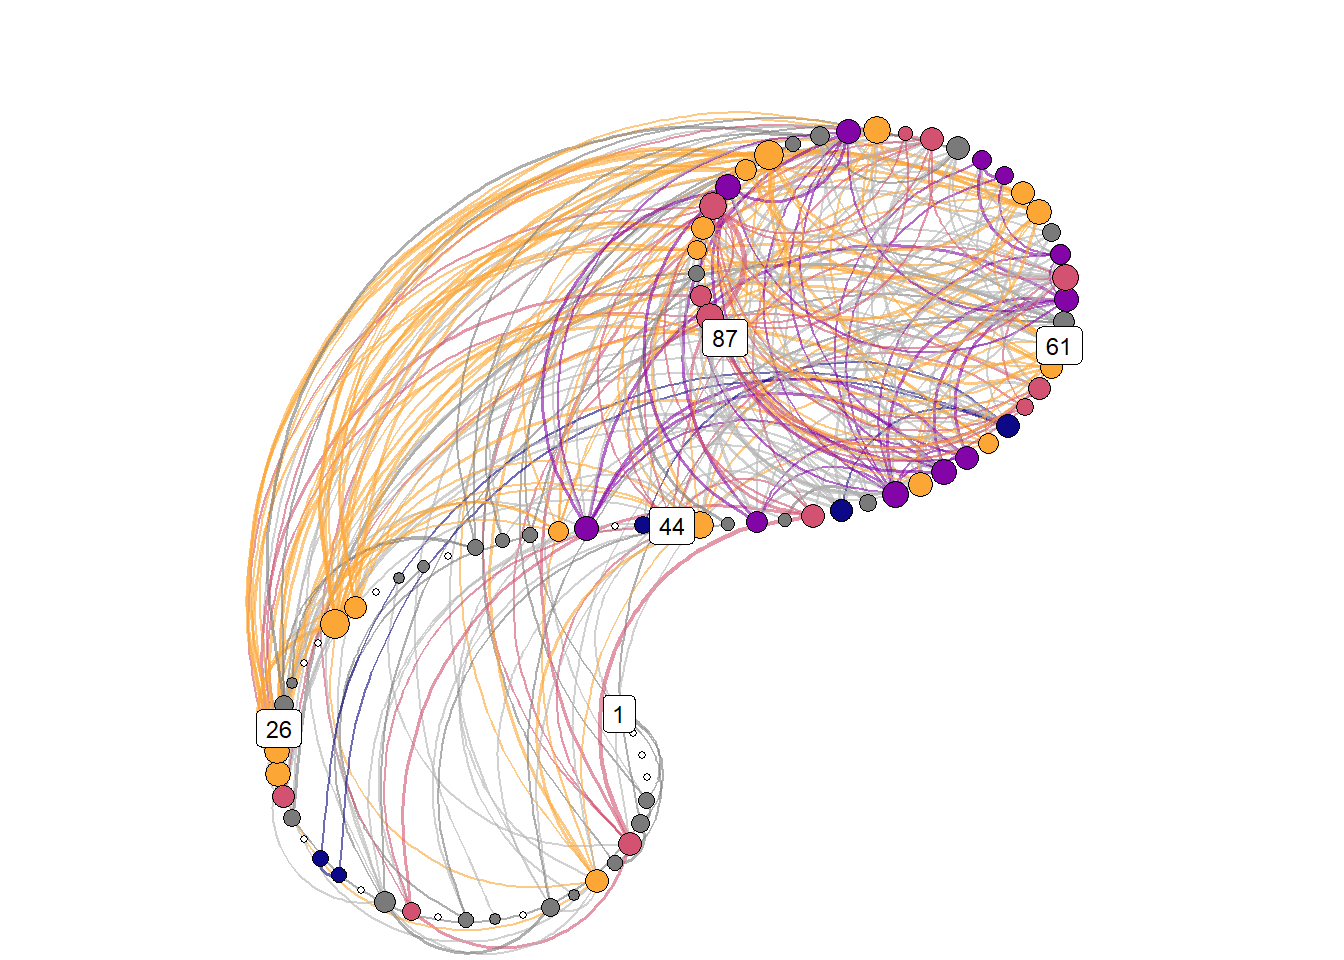
# emadata_nested_wrangled_both_recnets_nodes_plots$spiralgraph_epochs[[1]] +
#   theme(plot.margin=grid::unit(c(0,0,0,0), "mm"))

# ggsave(filename = "./figures/recnetwork.png",
#        width = 7,
#        height = 7)

# emadata_nested_wrangled_both_recnets_nodes_plots$all_nodes_with_strengths[[1]]
Attractor plot
emadata_nested_wrangled_both_recnets_nodes_plots <- emadata_nested_wrangled_both_recnets_nodes_plots %>%
  dplyr::mutate(observations = purrr::map_dbl(.x = data_firstlast_divided_by_max,
                                              .f = ~nrow(.)))

emadata_nested_wrangled_both_recnets_nodes_plots <- emadata_nested_wrangled_both_recnets_nodes_plots %>%
  dplyr::mutate(observations_daily = purrr::map_dbl(.x = data_daily,
                                              .f = ~nrow(.)))


emadata_nested_wrangled_both_recnets_nodes_plots <- emadata_nested_wrangled_both_recnets_nodes_plots %>%
  dplyr::mutate(
    attractor_plots =
      purrr::pmap(list(..1 = all_nodes_with_strengths,
                       ..2 = observations,
                       ..3 = observations_daily,
                       ..4 = User),
                  .f = ~{
                    dplyr::mutate(..1,
                                  strength_rescaled =
                                    scales::rescale(strength, to = c(0.3, 1.1)),
                                  alpha_strength = ifelse(strength_rescaled == 0.3,
                                                          0.5,
                                                          strength_rescaled)) %>%
                      ggplot(data = .,
                             aes(x = forcats::fct_rev(name),
                                 y = value,
                                 size = strength_rescaled,
                                 alpha = alpha_strength,
                                 color = attractors_n)) +
                      scale_size_identity() +
                      scale_alpha_identity() +
                      geom_point(aes(alpha = alpha_strength)) +
                      geom_line(aes(group = time,
                                    alpha = alpha_strength)) +
                      scale_color_manual(values = c(viridisLite::plasma(4,
                                                                        end = 0.8,
                                                                        direction = -1),
                                                    "gray40", "gray50")) +
                      scale_y_continuous(labels = scales::label_percent(accuracy = 1)) +
                      theme_bw() +
                      theme(legend.position = "none") +
                      labs(y = "Percentage of maximum reported value of variable, across full time series",
                           x = NULL,
                           title = paste0("Participant \"", ..4, "\" - based on ", ..2, " data points (", ..3, " days)"),
                           caption = paste0("Recurrence rate used for the analysis: ", scales::percent(recurrence_rate))) +
                      facet_wrap(~attractors_n) +
                      coord_flip(ylim = c(0, 1))
                  }
      ))

emadata_nested_wrangled_both_recnets_nodes_plots$attractor_plots[[1]]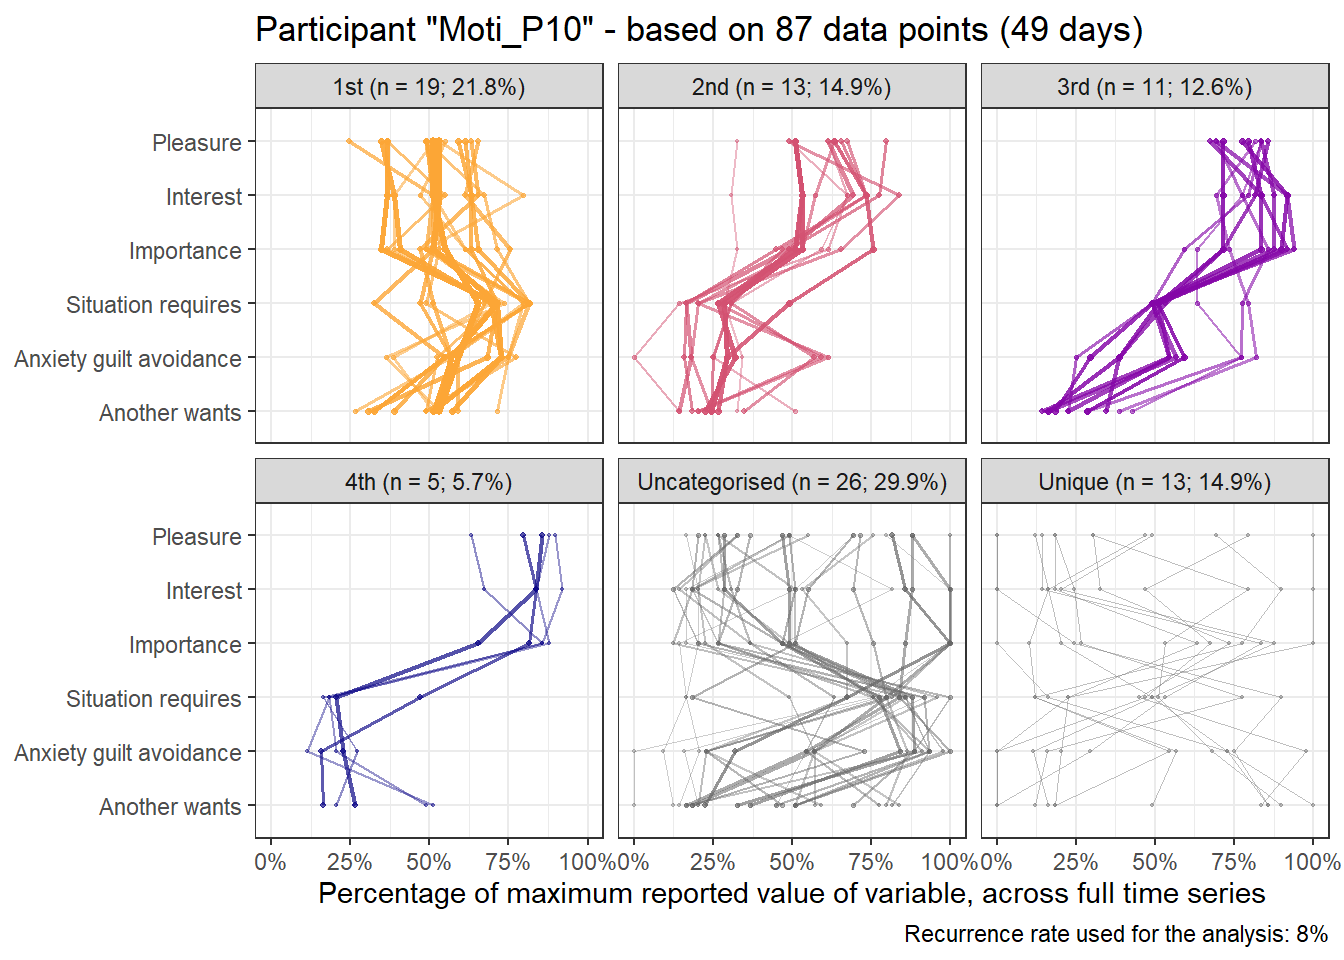
# emadata_nested_wrangled_both_recnets_nodes_plots$all_nodes_with_strengths[[1]]

# # Save this to be used for the task analysis later; otherwise overwritten by sensitivity analyses:
# firstlast_emadata_nested_wrangled_both_recnets_nodes_plots <-
#   emadata_nested_wrangled_both_recnets_nodes_plots

# cowplot::save_plot("./figures/attractors.png",
#                    emadata_nested_wrangled_both_recnets_nodes_plots$attractor_plots[[1]],
#                    dpi = 300,
#                    base_height = 11.69/2)
9%
Here’s the 6-dimensional motivation system’s recurrence plot, weighted by similarity.
recurrence_rate <- 0.09

set.seed(100)

#######################

# si = similarity under the radius
emadata_nested_wrangled_both_recnets <- emadata_nested_wrangled %>%
  dplyr::mutate(RN = purrr::map(.x = data_firstlast_divided_by_max,
                                .f =  ~casnet::rn(.x %>% dplyr::select(#autonomy, competence, relatedness,
                                                                       pleasure, interest, importance,
                                                                       situation_requires,
                                                                       anxiety_guilt_avoidance,
                                                                       another_wants),
                                                  doEmbed = FALSE,
                                                  weighted = TRUE,
                                                  weightedBy = "si",
                                                  emRad = NA,
                                                  targetValue = recurrence_rate)))
##
## Auto-recurrence: Setting diagonal to (1 + max. distance) for analyses
##
## Searching for a radius that will yield 0.09 for RR

emadata_nested_wrangled_both_recnets <- emadata_nested_wrangled_both_recnets %>%
  dplyr::mutate(graph_from_adjacency = purrr::map(.x = RN,
                                                  .f = ~igraph::graph_from_adjacency_matrix(.x,
                                                                                            weighted = TRUE,
                                                                                            mode = "upper",
                                                                                            diag = FALSE)))

# Edges with their distances
emadata_nested_wrangled_both_recnets <- emadata_nested_wrangled_both_recnets %>%
  dplyr::mutate(edges_with_distances = purrr::map(.x = graph_from_adjacency,
                                                  .f = ~igraph::E(.x)$weight),
                graph_from_adjacency_orig = graph_from_adjacency)

# Larger values are closer to the state; inverse of weight makes it more intuitive
for (i in 1:nrow(emadata_nested_wrangled_both_recnets)) {
igraph::E(emadata_nested_wrangled_both_recnets$graph_from_adjacency[[i]])$weight <- (1/emadata_nested_wrangled_both_recnets$edges_with_distances[[i]])
}
# A later note to self: Now weight is a measure of distance; how far apart two time points are
# (under the radius, i.e. they're reasonably similar to begin with)

####### To check:
# igraph::E(emadata_nested_wrangled_both_recnets$graph_from_adjacency[[1]])$weight
# igraph::E(emadata_nested_wrangled_both_recnets$graph_from_adjacency_orig[[1]])$weight

emadata_nested_wrangled_both_recnets <- emadata_nested_wrangled_both_recnets %>%
  dplyr::mutate(RN_plot = purrr::map(.x = RN,
                                .f =  ~casnet::rn_plot(.x,
                                                       plotDimensions = TRUE,
                                                       xlab = "6-dimensional motivation system",
                                                       ylab = "6-dimensional motivation system")))
# Make node size equal to strength. Strength is the sum of a node's edge weights.
for (i in 1:nrow(emadata_nested_wrangled_both_recnets)) {
igraph::V(emadata_nested_wrangled_both_recnets$graph_from_adjacency[[i]])$size <- (igraph::strength(emadata_nested_wrangled_both_recnets$graph_from_adjacency[[i]]))
}

# Rescaling weight as "width"; varies between 5 and 10
for (i in 1:nrow(emadata_nested_wrangled_both_recnets)) {
igraph::E(emadata_nested_wrangled_both_recnets$graph_from_adjacency[[i]])$width <-
  casnet::elascer(igraph::E(emadata_nested_wrangled_both_recnets$graph_from_adjacency[[i]])$weight, lo = 5, hi = 10)
}
The lengthy code chunk below extracts and marks attractors in the data.
# Get number of maximally connected node
emadata_nested_wrangled_both_recnets_nodes <- emadata_nested_wrangled_both_recnets %>%
dplyr::mutate(strongest_day = purrr::map(.x = graph_from_adjacency,
.f = ~which.max(igraph::strength(.x))
))
emadata_nested_wrangled_both_recnets_nodes <- emadata_nested_wrangled_both_recnets_nodes %>%
dplyr::mutate(list_of_edges = purrr::map(.x = graph_from_adjacency,
.f = ~igraph::get.data.frame(.x)
))
emadata_nested_wrangled_both_recnets_nodes <- emadata_nested_wrangled_both_recnets_nodes %>%
dplyr::mutate(all_nodes_with_strengths =
purrr::map2(.x = data_firstlast_divided_by_max,
.y = graph_from_adjacency,
.f = ~{
data.frame(.x,
strength = igraph::strength(.y)) %>%
dplyr::mutate(time = dplyr::row_number()) %>%
tidyr::pivot_longer(cols = c(-strength, -time))
}
))
# Extract nodes (i.e. times) which connect to the strongest (i.e. most connected) node
emadata_nested_wrangled_both_recnets_nodes <- emadata_nested_wrangled_both_recnets_nodes %>%
dplyr::mutate(connecting_to_strongest = purrr::map2(.x = list_of_edges,
.y = strongest_day,
.f = ~{
.x %>% dplyr::filter(from == .y | to == .y) %>%
dplyr::arrange(weight) %>%
tidyr::pivot_longer(cols = c(from, to),
values_to = "node") %>%
dplyr::distinct(node,
#.keep_all = TRUE
) %>%
dplyr::pull(node)
}
)
)
emadata_nested_wrangled_both_recnets_nodes <- emadata_nested_wrangled_both_recnets_nodes %>%
dplyr::mutate(all_nodes_with_strengths = purrr::map2(.x = all_nodes_with_strengths,
.y = connecting_to_strongest,
.f = ~{
dplyr::mutate(.x,
connecting_to_strongest =
dplyr::case_when(time %in% .y ~ TRUE,
TRUE ~ FALSE))
}
))
# Get number of 2nd maximally connected node, which doesn't connect to the 1st
emadata_nested_wrangled_both_recnets_nodes <- emadata_nested_wrangled_both_recnets_nodes %>%
dplyr::mutate(secondary_attractor_day = purrr::map2(.x = graph_from_adjacency,
.y = connecting_to_strongest,
.f = ~{
data.frame(strength = igraph::strength(.x),
time = 1:length(igraph::strength(.x))) %>%
dplyr::filter(!time %in% .y) %>%
dplyr::arrange(desc(strength)) %>%
dplyr::slice(1) %>%
dplyr::pull(time)
}
))
# Extract nodes (i.e. times) which connect to the 2nd strongest node, which doesn't connect to the 1st
emadata_nested_wrangled_both_recnets_nodes <- emadata_nested_wrangled_both_recnets_nodes %>%
dplyr::mutate(connecting_to_2nd_strongest = purrr::map2(.x = list_of_edges,
.y = secondary_attractor_day,
.f = ~{
.x %>% dplyr::filter(from == .y | to == .y) %>%
dplyr::arrange(weight) %>%
tidyr::pivot_longer(cols = c(from, to),
values_to = "node") %>%
dplyr::distinct(node,
#.keep_all = TRUE
) %>%
dplyr::pull(node)
}
)
)
# Save as a variable in the dataset
emadata_nested_wrangled_both_recnets_nodes <- emadata_nested_wrangled_both_recnets_nodes %>%
dplyr::mutate(all_nodes_with_strengths = purrr::map2(.x = all_nodes_with_strengths,
.y = connecting_to_2nd_strongest,
.f = ~{
dplyr::mutate(.x,
connecting_to_2nd_strongest =
dplyr::case_when(time %in% .y ~ TRUE,
TRUE ~ FALSE))
}
))
# Get number of 3rd maximally connected node, which doesn't connect to the 1st or second
emadata_nested_wrangled_both_recnets_nodes <- emadata_nested_wrangled_both_recnets_nodes %>%
dplyr::mutate(tertiary_attractor_day = purrr::pmap(list(..1 = graph_from_adjacency,
..2 = connecting_to_strongest,
..3 = connecting_to_2nd_strongest),
.f = ~{
data.frame(strength = igraph::strength(..1),
time = 1:length(igraph::strength(..1))) %>%
dplyr::filter(!time %in% ..2,
!time %in% ..3) %>%
dplyr::arrange(desc(strength)) %>%
dplyr::slice(1) %>%
dplyr::pull(time)
}
))
# Extract nodes (i.e. times) which connect to the 3rd strongest node
emadata_nested_wrangled_both_recnets_nodes <- emadata_nested_wrangled_both_recnets_nodes %>%
dplyr::mutate(connecting_to_3rd_strongest = purrr::map2(.x = list_of_edges,
.y = tertiary_attractor_day,
.f = ~{
.x %>% dplyr::filter(from == .y | to == .y) %>%
dplyr::arrange(weight) %>%
tidyr::pivot_longer(cols = c(from, to),
values_to = "node") %>%
dplyr::distinct(node,
#.keep_all = TRUE
) %>%
dplyr::pull(node)
}
)
)
# Save as a variable
emadata_nested_wrangled_both_recnets_nodes <- emadata_nested_wrangled_both_recnets_nodes %>%
dplyr::mutate(all_nodes_with_strengths = purrr::map2(.x = all_nodes_with_strengths,
.y = connecting_to_3rd_strongest,
.f = ~{
dplyr::mutate(.x,
connecting_to_3rd_strongest =
dplyr::case_when(time %in% .y ~ TRUE,
TRUE ~ FALSE))
}
))
# Get number of 4th maximally connected node, which doesn't connect to the 1st, 2nd, or 3rd
emadata_nested_wrangled_both_recnets_nodes <- emadata_nested_wrangled_both_recnets_nodes %>%
dplyr::mutate(fourth_attractor_day = purrr::pmap(list(..1 = graph_from_adjacency,
..2 = connecting_to_strongest,
..3 = connecting_to_2nd_strongest,
..4 = connecting_to_3rd_strongest),
.f = ~{
data.frame(strength = igraph::strength(..1),
time = 1:length(igraph::strength(..1))) %>%
dplyr::filter(!time %in% ..2,
!time %in% ..3,
!time %in% ..4) %>%
dplyr::arrange(desc(strength)) %>%
dplyr::slice(1) %>%
dplyr::pull(time)
}
))
# Extract nodes (i.e. times) which connect to the 4th strongest node
emadata_nested_wrangled_both_recnets_nodes <- emadata_nested_wrangled_both_recnets_nodes %>%
dplyr::mutate(connecting_to_4th_strongest = purrr::map2(.x = list_of_edges,
.y = fourth_attractor_day,
.f = ~{
.x %>% dplyr::filter(from == .y | to == .y) %>%
dplyr::arrange(weight) %>%
tidyr::pivot_longer(cols = c(from, to),
values_to = "node") %>%
dplyr::distinct(node,
#.keep_all = TRUE
) %>%
dplyr::pull(node)
}
)
)
# Save as a variable
emadata_nested_wrangled_both_recnets_nodes <- emadata_nested_wrangled_both_recnets_nodes %>%
dplyr::mutate(all_nodes_with_strengths = purrr::map2(.x = all_nodes_with_strengths,
.y = connecting_to_4th_strongest,
.f = ~{
dplyr::mutate(.x,
connecting_to_4th_strongest =
dplyr::case_when(time %in% .y ~ TRUE,
TRUE ~ FALSE))
}
))
################### Make plots
emadata_nested_wrangled_both_recnets_nodes_plots <- emadata_nested_wrangled_both_recnets_nodes %>%
dplyr::mutate(all_nodes_with_strengths =
purrr::map(.x = all_nodes_with_strengths,
.f = ~{
dplyr::mutate(.x,
attractors = dplyr::case_when(
strength == 0 ~ "Unique",
connecting_to_strongest == TRUE ~ "1st",
connecting_to_2nd_strongest == TRUE ~ "2nd",
connecting_to_3rd_strongest == TRUE ~ "3rd",
connecting_to_4th_strongest == TRUE ~ "4th",
TRUE ~ "Uncategorised"),
attractors = factor(attractors,
levels = c("1st",
"2nd",
"3rd",
"4th",
"Uncategorised",
"Unique")),
name = factor(name,
levels = c("pleasure",
"interest",
"importance",
"situation_requires",
"anxiety_guilt_avoidance",
"another_wants"),
labels = c("Pleasure",
"Interest",
"Importance",
"Situation requires",
"Anxiety guilt avoidance",
"Another wants")) %>%
forcats::fct_drop()) %>%
dplyr::group_by(attractors, name) %>%
dplyr::mutate(n = n()) %>%
dplyr::ungroup() %>%
dplyr::mutate(maxtime = max(time),
percentage_of_total =
(n / maxtime) %>% scales::percent(accuracy = 0.1),
proportion_of_total = n/maxtime,
attractors_n =
factor(paste0(attractors,
" (n = ", n, "; ",
percentage_of_total, ")")))
}
))Spiral graph with colored nodes
emadata_nested_wrangled_both_recnets_nodes_plots <- emadata_nested_wrangled_both_recnets_nodes_plots %>%
  dplyr::mutate(node_colors = purrr::map(.x = all_nodes_with_strengths,
                                         .f = ~{tidyr::pivot_wider(.x, names_from = name) %>%
                                             dplyr::pull(attractors)}))

for (i in 1:nrow(emadata_nested_wrangled_both_recnets_nodes_plots)) {
levels(emadata_nested_wrangled_both_recnets_nodes_plots$node_colors[[i]]) <-
  c(viridisLite::plasma(4,
                      end = 0.8,
                      direction = -1), "gray48", "white")
  }

emadata_nested_wrangled_both_recnets_nodes_plots <- emadata_nested_wrangled_both_recnets_nodes_plots %>%
  dplyr::mutate(spiralgraph_epochs = purrr::pmap(list(..1 = graph_from_adjacency,
                                          ..2 = node_colors,
                                          ..3 = User),
                                     .f =  ~casnet::make_spiral_graph(g = ..1,
                                                                      arcs = 4,
                                                                      # a = .1,
                                                                      # b = 2,
                                                                      markTimeBy = TRUE,
                                                                      markEpochsBy = ..2,
                                                                      epochColours = ..2,
                                                                      showEpochLegend = FALSE,
                                                                      scaleEdgeSize = 1/10,
                                                                      scaleVertexSize = c(1, 5),
                                                                      showSizeLegend = FALSE,
                                                                      sizeLabel = "Node strength",
                                                                      type = "Euler",
                                                                      # alphaE = 0.1
                                                                      # title = ..3
                                     )))
# emadata_nested_wrangled_both_recnets_nodes_plots$spiralgraph_epochs[[1]] +
#   theme(plot.margin=grid::unit(c(0,0,0,0), "mm"))

# ggsave(filename = "./figures/recnetwork.png",
#        width = 7,
#        height = 7)

# emadata_nested_wrangled_both_recnets_nodes_plots$all_nodes_with_strengths[[1]]
Attractor plot
emadata_nested_wrangled_both_recnets_nodes_plots <- emadata_nested_wrangled_both_recnets_nodes_plots %>%
  dplyr::mutate(observations = purrr::map_dbl(.x = data_firstlast_divided_by_max,
                                              .f = ~nrow(.)))

emadata_nested_wrangled_both_recnets_nodes_plots <- emadata_nested_wrangled_both_recnets_nodes_plots %>%
  dplyr::mutate(observations_daily = purrr::map_dbl(.x = data_daily,
                                              .f = ~nrow(.)))


emadata_nested_wrangled_both_recnets_nodes_plots <- emadata_nested_wrangled_both_recnets_nodes_plots %>%
  dplyr::mutate(
    attractor_plots =
      purrr::pmap(list(..1 = all_nodes_with_strengths,
                       ..2 = observations,
                       ..3 = observations_daily,
                       ..4 = User),
                  .f = ~{
                    dplyr::mutate(..1,
                                  strength_rescaled =
                                    scales::rescale(strength, to = c(0.3, 1.1)),
                                  alpha_strength = ifelse(strength_rescaled == 0.3,
                                                          0.5,
                                                          strength_rescaled)) %>%
                      ggplot(data = .,
                             aes(x = forcats::fct_rev(name),
                                 y = value,
                                 size = strength_rescaled,
                                 alpha = alpha_strength,
                                 color = attractors_n)) +
                      scale_size_identity() +
                      scale_alpha_identity() +
                      geom_point(aes(alpha = alpha_strength)) +
                      geom_line(aes(group = time,
                                    alpha = alpha_strength)) +
                      scale_color_manual(values = c(viridisLite::plasma(4,
                                                                        end = 0.8,
                                                                        direction = -1),
                                                    "gray40", "gray50")) +
                      scale_y_continuous(labels = scales::label_percent(accuracy = 1)) +
                      theme_bw() +
                      theme(legend.position = "none") +
                      labs(y = "Percentage of maximum reported value of variable, across full time series",
                           x = NULL,
                           title = paste0("Participant \"", ..4, "\" - based on ", ..2, " data points (", ..3, " days)"),
                           caption = paste0("Recurrence rate used for the analysis: ", scales::percent(recurrence_rate))) +
                      facet_wrap(~attractors_n) +
                      coord_flip(ylim = c(0, 1))
                  }
      ))

emadata_nested_wrangled_both_recnets_nodes_plots$attractor_plots[[1]]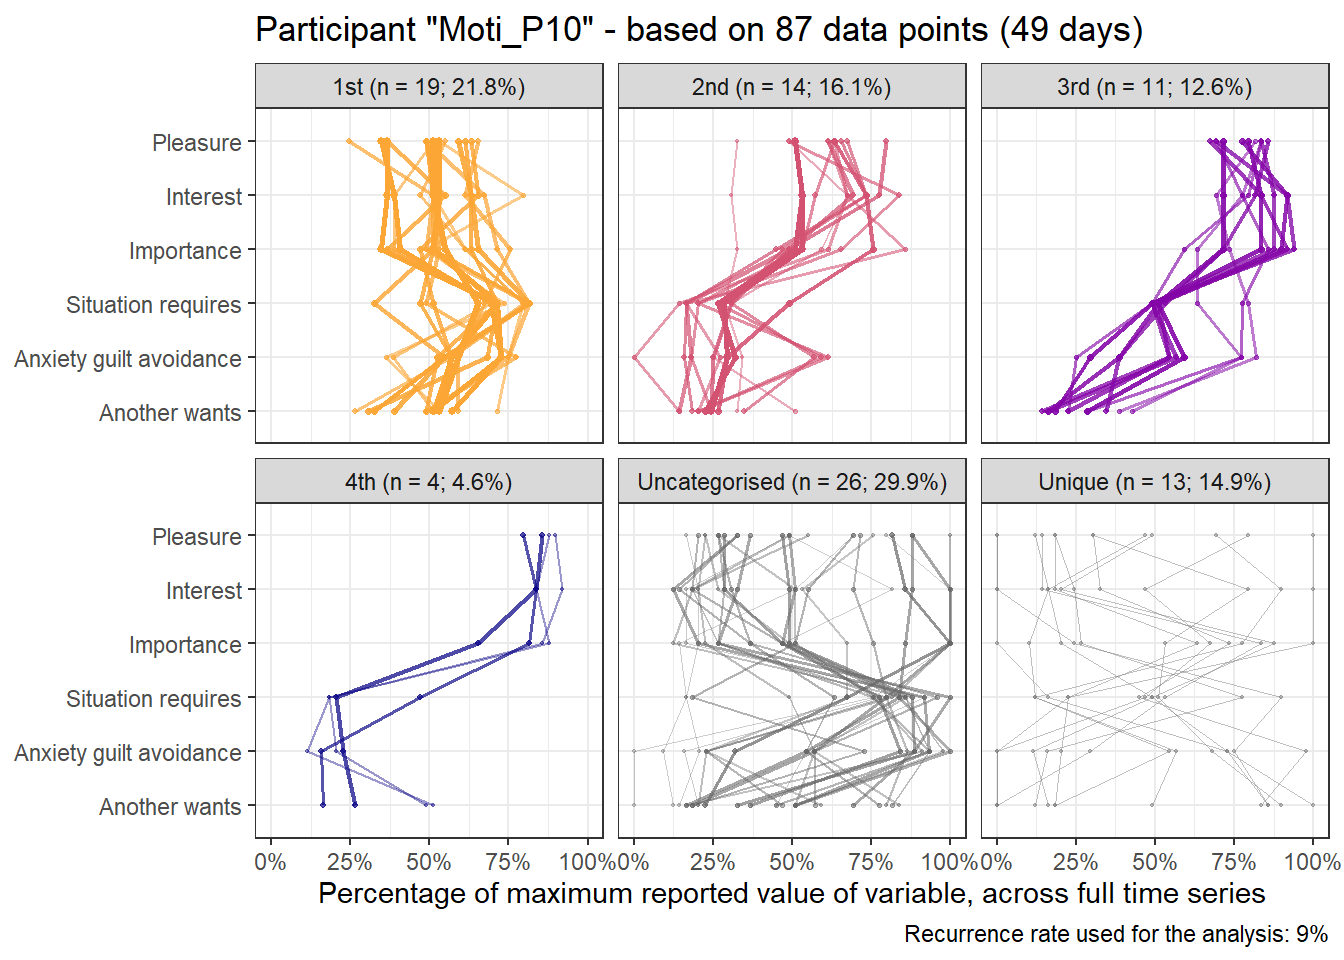
# emadata_nested_wrangled_both_recnets_nodes_plots$all_nodes_with_strengths[[1]]

# # Save this to be used for the task analysis later; otherwise overwritten by sensitivity analyses:
# firstlast_emadata_nested_wrangled_both_recnets_nodes_plots <-
#   emadata_nested_wrangled_both_recnets_nodes_plots

# cowplot::save_plot("./figures/attractors.png",
#                    emadata_nested_wrangled_both_recnets_nodes_plots$attractor_plots[[1]],
#                    dpi = 300,
#                    base_height = 11.69/2)
10%
Here’s the 6-dimensional motivation system’s recurrence plot, weighted by similarity.
recurrence_rate <- 0.10

set.seed(100)

#######################

# si = similarity under the radius
emadata_nested_wrangled_both_recnets <- emadata_nested_wrangled %>%
  dplyr::mutate(RN = purrr::map(.x = data_firstlast_divided_by_max,
                                .f =  ~casnet::rn(.x %>% dplyr::select(#autonomy, competence, relatedness,
                                                                       pleasure, interest, importance,
                                                                       situation_requires,
                                                                       anxiety_guilt_avoidance,
                                                                       another_wants),
                                                  doEmbed = FALSE,
                                                  weighted = TRUE,
                                                  weightedBy = "si",
                                                  emRad = NA,
                                                  targetValue = recurrence_rate)))
##
## Auto-recurrence: Setting diagonal to (1 + max. distance) for analyses
##
## Searching for a radius that will yield 0.1 for RR

emadata_nested_wrangled_both_recnets <- emadata_nested_wrangled_both_recnets %>%
  dplyr::mutate(graph_from_adjacency = purrr::map(.x = RN,
                                                  .f = ~igraph::graph_from_adjacency_matrix(.x,
                                                                                            weighted = TRUE,
                                                                                            mode = "upper",
                                                                                            diag = FALSE)))

# Edges with their distances
emadata_nested_wrangled_both_recnets <- emadata_nested_wrangled_both_recnets %>%
  dplyr::mutate(edges_with_distances = purrr::map(.x = graph_from_adjacency,
                                                  .f = ~igraph::E(.x)$weight),
                graph_from_adjacency_orig = graph_from_adjacency)

# Larger values are closer to the state; inverse of weight makes it more intuitive
for (i in 1:nrow(emadata_nested_wrangled_both_recnets)) {
igraph::E(emadata_nested_wrangled_both_recnets$graph_from_adjacency[[i]])$weight <- (1/emadata_nested_wrangled_both_recnets$edges_with_distances[[i]])
}
# A later note to self: Now weight is a measure of distance; how far apart two time points are
# (under the radius, i.e. they're reasonably similar to begin with)

####### To check:
# igraph::E(emadata_nested_wrangled_both_recnets$graph_from_adjacency[[1]])$weight
# igraph::E(emadata_nested_wrangled_both_recnets$graph_from_adjacency_orig[[1]])$weight

emadata_nested_wrangled_both_recnets <- emadata_nested_wrangled_both_recnets %>%
  dplyr::mutate(RN_plot = purrr::map(.x = RN,
                                .f =  ~casnet::rn_plot(.x,
                                                       plotDimensions = TRUE,
                                                       xlab = "6-dimensional motivation system",
                                                       ylab = "6-dimensional motivation system")))
# Make node size equal to strength. Strength is the sum of a node's edge weights.
for (i in 1:nrow(emadata_nested_wrangled_both_recnets)) {
igraph::V(emadata_nested_wrangled_both_recnets$graph_from_adjacency[[i]])$size <- (igraph::strength(emadata_nested_wrangled_both_recnets$graph_from_adjacency[[i]]))
}

# Rescaling weight as "width"; varies between 5 and 10
for (i in 1:nrow(emadata_nested_wrangled_both_recnets)) {
igraph::E(emadata_nested_wrangled_both_recnets$graph_from_adjacency[[i]])$width <-
  casnet::elascer(igraph::E(emadata_nested_wrangled_both_recnets$graph_from_adjacency[[i]])$weight, lo = 5, hi = 10)
}
The lengthy code chunk below extracts and marks attractors in the data.
# Get number of maximally connected node
emadata_nested_wrangled_both_recnets_nodes <- emadata_nested_wrangled_both_recnets %>%
dplyr::mutate(strongest_day = purrr::map(.x = graph_from_adjacency,
.f = ~which.max(igraph::strength(.x))
))
emadata_nested_wrangled_both_recnets_nodes <- emadata_nested_wrangled_both_recnets_nodes %>%
dplyr::mutate(list_of_edges = purrr::map(.x = graph_from_adjacency,
.f = ~igraph::get.data.frame(.x)
))
emadata_nested_wrangled_both_recnets_nodes <- emadata_nested_wrangled_both_recnets_nodes %>%
dplyr::mutate(all_nodes_with_strengths =
purrr::map2(.x = data_firstlast_divided_by_max,
.y = graph_from_adjacency,
.f = ~{
data.frame(.x,
strength = igraph::strength(.y)) %>%
dplyr::mutate(time = dplyr::row_number()) %>%
tidyr::pivot_longer(cols = c(-strength, -time))
}
))
# Extract nodes (i.e. times) which connect to the strongest (i.e. most connected) node
emadata_nested_wrangled_both_recnets_nodes <- emadata_nested_wrangled_both_recnets_nodes %>%
dplyr::mutate(connecting_to_strongest = purrr::map2(.x = list_of_edges,
.y = strongest_day,
.f = ~{
.x %>% dplyr::filter(from == .y | to == .y) %>%
dplyr::arrange(weight) %>%
tidyr::pivot_longer(cols = c(from, to),
values_to = "node") %>%
dplyr::distinct(node,
#.keep_all = TRUE
) %>%
dplyr::pull(node)
}
)
)
emadata_nested_wrangled_both_recnets_nodes <- emadata_nested_wrangled_both_recnets_nodes %>%
dplyr::mutate(all_nodes_with_strengths = purrr::map2(.x = all_nodes_with_strengths,
.y = connecting_to_strongest,
.f = ~{
dplyr::mutate(.x,
connecting_to_strongest =
dplyr::case_when(time %in% .y ~ TRUE,
TRUE ~ FALSE))
}
))
# Get number of 2nd maximally connected node, which doesn't connect to the 1st
emadata_nested_wrangled_both_recnets_nodes <- emadata_nested_wrangled_both_recnets_nodes %>%
dplyr::mutate(secondary_attractor_day = purrr::map2(.x = graph_from_adjacency,
.y = connecting_to_strongest,
.f = ~{
data.frame(strength = igraph::strength(.x),
time = 1:length(igraph::strength(.x))) %>%
dplyr::filter(!time %in% .y) %>%
dplyr::arrange(desc(strength)) %>%
dplyr::slice(1) %>%
dplyr::pull(time)
}
))
# Extract nodes (i.e. times) which connect to the 2nd strongest node, which doesn't connect to the 1st
emadata_nested_wrangled_both_recnets_nodes <- emadata_nested_wrangled_both_recnets_nodes %>%
dplyr::mutate(connecting_to_2nd_strongest = purrr::map2(.x = list_of_edges,
.y = secondary_attractor_day,
.f = ~{
.x %>% dplyr::filter(from == .y | to == .y) %>%
dplyr::arrange(weight) %>%
tidyr::pivot_longer(cols = c(from, to),
values_to = "node") %>%
dplyr::distinct(node,
#.keep_all = TRUE
) %>%
dplyr::pull(node)
}
)
)
# Save as a variable in the dataset
emadata_nested_wrangled_both_recnets_nodes <- emadata_nested_wrangled_both_recnets_nodes %>%
dplyr::mutate(all_nodes_with_strengths = purrr::map2(.x = all_nodes_with_strengths,
.y = connecting_to_2nd_strongest,
.f = ~{
dplyr::mutate(.x,
connecting_to_2nd_strongest =
dplyr::case_when(time %in% .y ~ TRUE,
TRUE ~ FALSE))
}
))
# Get number of 3rd maximally connected node, which doesn't connect to the 1st or second
emadata_nested_wrangled_both_recnets_nodes <- emadata_nested_wrangled_both_recnets_nodes %>%
dplyr::mutate(tertiary_attractor_day = purrr::pmap(list(..1 = graph_from_adjacency,
..2 = connecting_to_strongest,
..3 = connecting_to_2nd_strongest),
.f = ~{
data.frame(strength = igraph::strength(..1),
time = 1:length(igraph::strength(..1))) %>%
dplyr::filter(!time %in% ..2,
!time %in% ..3) %>%
dplyr::arrange(desc(strength)) %>%
dplyr::slice(1) %>%
dplyr::pull(time)
}
))
# Extract nodes (i.e. times) which connect to the 3rd strongest node
emadata_nested_wrangled_both_recnets_nodes <- emadata_nested_wrangled_both_recnets_nodes %>%
dplyr::mutate(connecting_to_3rd_strongest = purrr::map2(.x = list_of_edges,
.y = tertiary_attractor_day,
.f = ~{
.x %>% dplyr::filter(from == .y | to == .y) %>%
dplyr::arrange(weight) %>%
tidyr::pivot_longer(cols = c(from, to),
values_to = "node") %>%
dplyr::distinct(node,
#.keep_all = TRUE
) %>%
dplyr::pull(node)
}
)
)
# Save as a variable
emadata_nested_wrangled_both_recnets_nodes <- emadata_nested_wrangled_both_recnets_nodes %>%
dplyr::mutate(all_nodes_with_strengths = purrr::map2(.x = all_nodes_with_strengths,
.y = connecting_to_3rd_strongest,
.f = ~{
dplyr::mutate(.x,
connecting_to_3rd_strongest =
dplyr::case_when(time %in% .y ~ TRUE,
TRUE ~ FALSE))
}
))
# Get number of 4th maximally connected node, which doesn't connect to the 1st, 2nd, or 3rd
emadata_nested_wrangled_both_recnets_nodes <- emadata_nested_wrangled_both_recnets_nodes %>%
dplyr::mutate(fourth_attractor_day = purrr::pmap(list(..1 = graph_from_adjacency,
..2 = connecting_to_strongest,
..3 = connecting_to_2nd_strongest,
..4 = connecting_to_3rd_strongest),
.f = ~{
data.frame(strength = igraph::strength(..1),
time = 1:length(igraph::strength(..1))) %>%
dplyr::filter(!time %in% ..2,
!time %in% ..3,
!time %in% ..4) %>%
dplyr::arrange(desc(strength)) %>%
dplyr::slice(1) %>%
dplyr::pull(time)
}
))
# Extract nodes (i.e. times) which connect to the 4th strongest node
emadata_nested_wrangled_both_recnets_nodes <- emadata_nested_wrangled_both_recnets_nodes %>%
dplyr::mutate(connecting_to_4th_strongest = purrr::map2(.x = list_of_edges,
.y = fourth_attractor_day,
.f = ~{
.x %>% dplyr::filter(from == .y | to == .y) %>%
dplyr::arrange(weight) %>%
tidyr::pivot_longer(cols = c(from, to),
values_to = "node") %>%
dplyr::distinct(node,
#.keep_all = TRUE
) %>%
dplyr::pull(node)
}
)
)
# Save as a variable
emadata_nested_wrangled_both_recnets_nodes <- emadata_nested_wrangled_both_recnets_nodes %>%
dplyr::mutate(all_nodes_with_strengths = purrr::map2(.x = all_nodes_with_strengths,
.y = connecting_to_4th_strongest,
.f = ~{
dplyr::mutate(.x,
connecting_to_4th_strongest =
dplyr::case_when(time %in% .y ~ TRUE,
TRUE ~ FALSE))
}
))
################### Make plots
emadata_nested_wrangled_both_recnets_nodes_plots <- emadata_nested_wrangled_both_recnets_nodes %>%
dplyr::mutate(all_nodes_with_strengths =
purrr::map(.x = all_nodes_with_strengths,
.f = ~{
dplyr::mutate(.x,
attractors = dplyr::case_when(
strength == 0 ~ "Unique",
connecting_to_strongest == TRUE ~ "1st",
connecting_to_2nd_strongest == TRUE ~ "2nd",
connecting_to_3rd_strongest == TRUE ~ "3rd",
connecting_to_4th_strongest == TRUE ~ "4th",
TRUE ~ "Uncategorised"),
attractors = factor(attractors,
levels = c("1st",
"2nd",
"3rd",
"4th",
"Uncategorised",
"Unique")),
name = factor(name,
levels = c("pleasure",
"interest",
"importance",
"situation_requires",
"anxiety_guilt_avoidance",
"another_wants"),
labels = c("Pleasure",
"Interest",
"Importance",
"Situation requires",
"Anxiety guilt avoidance",
"Another wants")) %>%
forcats::fct_drop()) %>%
dplyr::group_by(attractors, name) %>%
dplyr::mutate(n = n()) %>%
dplyr::ungroup() %>%
dplyr::mutate(maxtime = max(time),
percentage_of_total =
(n / maxtime) %>% scales::percent(accuracy = 0.1),
proportion_of_total = n/maxtime,
attractors_n =
factor(paste0(attractors,
" (n = ", n, "; ",
percentage_of_total, ")")))
}
))Spiral graph with colored nodes
emadata_nested_wrangled_both_recnets_nodes_plots <- emadata_nested_wrangled_both_recnets_nodes_plots %>%
  dplyr::mutate(node_colors = purrr::map(.x = all_nodes_with_strengths,
                                         .f = ~{tidyr::pivot_wider(.x, names_from = name) %>%
                                             dplyr::pull(attractors)}))

for (i in 1:nrow(emadata_nested_wrangled_both_recnets_nodes_plots)) {
levels(emadata_nested_wrangled_both_recnets_nodes_plots$node_colors[[i]]) <-
  c(viridisLite::plasma(4,
                      end = 0.8,
                      direction = -1), "gray48", "white")
  }

emadata_nested_wrangled_both_recnets_nodes_plots <- emadata_nested_wrangled_both_recnets_nodes_plots %>%
  dplyr::mutate(spiralgraph_epochs = purrr::pmap(list(..1 = graph_from_adjacency,
                                          ..2 = node_colors,
                                          ..3 = User),
                                     .f =  ~casnet::make_spiral_graph(g = ..1,
                                                                      arcs = 4,
                                                                      # a = .1,
                                                                      # b = 2,
                                                                      markTimeBy = TRUE,
                                                                      markEpochsBy = ..2,
                                                                      epochColours = ..2,
                                                                      showEpochLegend = FALSE,
                                                                      scaleEdgeSize = 1/10,
                                                                      scaleVertexSize = c(1, 5),
                                                                      showSizeLegend = FALSE,
                                                                      sizeLabel = "Node strength",
                                                                      type = "Euler",
                                                                      # alphaE = 0.1
                                                                      # title = ..3
                                     )))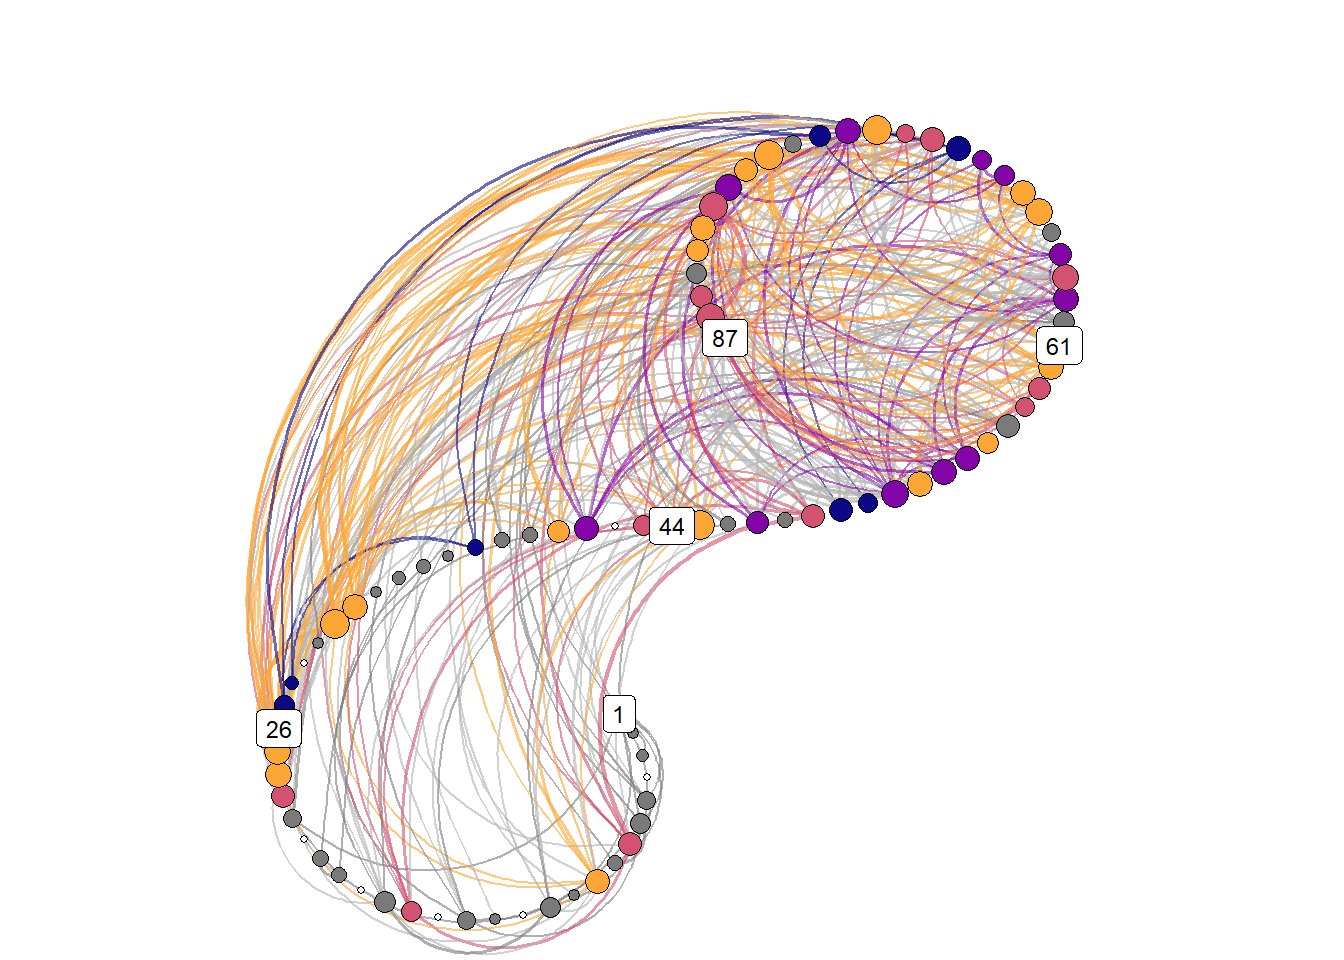
# emadata_nested_wrangled_both_recnets_nodes_plots$spiralgraph_epochs[[1]] +
#   theme(plot.margin=grid::unit(c(0,0,0,0), "mm"))

# ggsave(filename = "./figures/recnetwork.png",
#        width = 7,
#        height = 7)

# emadata_nested_wrangled_both_recnets_nodes_plots$all_nodes_with_strengths[[1]]
Attractor plot
emadata_nested_wrangled_both_recnets_nodes_plots <- emadata_nested_wrangled_both_recnets_nodes_plots %>%
  dplyr::mutate(observations = purrr::map_dbl(.x = data_firstlast_divided_by_max,
                                              .f = ~nrow(.)))

emadata_nested_wrangled_both_recnets_nodes_plots <- emadata_nested_wrangled_both_recnets_nodes_plots %>%
  dplyr::mutate(observations_daily = purrr::map_dbl(.x = data_daily,
                                              .f = ~nrow(.)))


emadata_nested_wrangled_both_recnets_nodes_plots <- emadata_nested_wrangled_both_recnets_nodes_plots %>%
  dplyr::mutate(
    attractor_plots =
      purrr::pmap(list(..1 = all_nodes_with_strengths,
                       ..2 = observations,
                       ..3 = observations_daily,
                       ..4 = User),
                  .f = ~{
                    dplyr::mutate(..1,
                                  strength_rescaled =
                                    scales::rescale(strength, to = c(0.3, 1.1)),
                                  alpha_strength = ifelse(strength_rescaled == 0.3,
                                                          0.5,
                                                          strength_rescaled)) %>%
                      ggplot(data = .,
                             aes(x = forcats::fct_rev(name),
                                 y = value,
                                 size = strength_rescaled,
                                 alpha = alpha_strength,
                                 color = attractors_n)) +
                      scale_size_identity() +
                      scale_alpha_identity() +
                      geom_point(aes(alpha = alpha_strength)) +
                      geom_line(aes(group = time,
                                    alpha = alpha_strength)) +
                      scale_color_manual(values = c(viridisLite::plasma(4,
                                                                        end = 0.8,
                                                                        direction = -1),
                                                    "gray40", "gray50")) +
                      scale_y_continuous(labels = scales::label_percent(accuracy = 1)) +
                      theme_bw() +
                      theme(legend.position = "none") +
                      labs(y = "Percentage of maximum reported value of variable, across full time series",
                           x = NULL,
                           title = paste0("Participant \"", ..4, "\" - based on ", ..2, " data points (", ..3, " days)"),
                           caption = paste0("Recurrence rate used for the analysis: ", scales::percent(recurrence_rate))) +
                      facet_wrap(~attractors_n) +
                      coord_flip(ylim = c(0, 1))
                  }
      ))

emadata_nested_wrangled_both_recnets_nodes_plots$attractor_plots[[1]]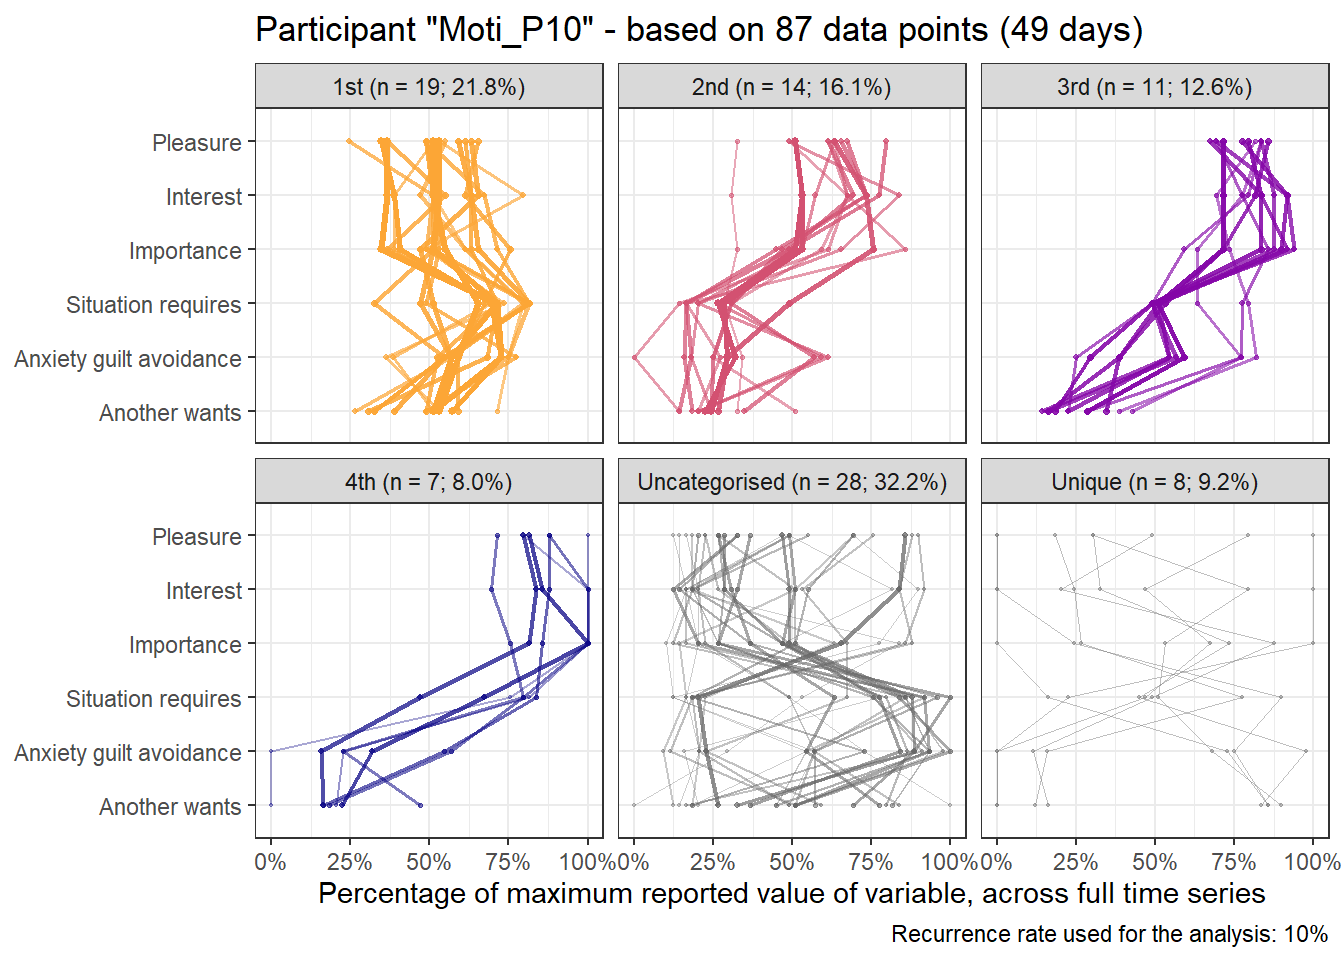
# emadata_nested_wrangled_both_recnets_nodes_plots$all_nodes_with_strengths[[1]]

# # Save this to be used for the task analysis later; otherwise overwritten by sensitivity analyses:
# firstlast_emadata_nested_wrangled_both_recnets_nodes_plots <-
#   emadata_nested_wrangled_both_recnets_nodes_plots

# cowplot::save_plot("./figures/attractors.png",
#                    emadata_nested_wrangled_both_recnets_nodes_plots$attractor_plots[[1]],
#                    dpi = 300,
#                    base_height = 11.69/2)
Robustness to distance measure
In this robustness check, we perform the analysis using Chebyshev distance instead of the Euclidean.
Here’s the 6-dimensional motivation system’s recurrence plot, weighted by similarity.
recurrence_rate <- 0.05

set.seed(100)

#######################

# si = similarity under the radius
emadata_nested_wrangled_both_recnets <- emadata_nested_wrangled %>%
  dplyr::mutate(RN = purrr::map(.x = data_firstlast_divided_by_max,
                                .f =  ~casnet::rn(.x %>% dplyr::select(#autonomy, competence, relatedness,
                                                                       pleasure, interest, importance,
                                                                       situation_requires,
                                                                       anxiety_guilt_avoidance,
                                                                       another_wants),
                                                  doEmbed = FALSE,
                                                  weighted = TRUE,
                                                  weightedBy = "si",
                                                  method = "max",
                                                  emRad = NA,
                                                  targetValue = recurrence_rate)))
##
## Auto-recurrence: Setting diagonal to (1 + max. distance) for analyses
##
## Searching for a radius that will yield 0.05 for RR

emadata_nested_wrangled_both_recnets <- emadata_nested_wrangled_both_recnets %>%
  dplyr::mutate(graph_from_adjacency = purrr::map(.x = RN,
                                                  .f = ~igraph::graph_from_adjacency_matrix(.x,
                                                                                            weighted = TRUE,
                                                                                            mode = "upper",
                                                                                            diag = FALSE)))

# Edges with their distances
emadata_nested_wrangled_both_recnets <- emadata_nested_wrangled_both_recnets %>%
  dplyr::mutate(edges_with_distances = purrr::map(.x = graph_from_adjacency,
                                                  .f = ~igraph::E(.x)$weight),
                graph_from_adjacency_orig = graph_from_adjacency)

# Larger values are closer to the state; inverse of weight makes it more intuitive
for (i in 1:nrow(emadata_nested_wrangled_both_recnets)) {
igraph::E(emadata_nested_wrangled_both_recnets$graph_from_adjacency[[i]])$weight <- (1/emadata_nested_wrangled_both_recnets$edges_with_distances[[i]])
}
# A later note to self: Now weight is a measure of distance; how far apart two time points are
# (under the radius, i.e. they're reasonably similar to begin with)

####### To check:
# igraph::E(emadata_nested_wrangled_both_recnets$graph_from_adjacency[[1]])$weight
# igraph::E(emadata_nested_wrangled_both_recnets$graph_from_adjacency_orig[[1]])$weight

emadata_nested_wrangled_both_recnets <- emadata_nested_wrangled_both_recnets %>%
  dplyr::mutate(RN_plot = purrr::map(.x = RN,
                                .f =  ~casnet::rn_plot(.x,
                                                       plotDimensions = TRUE,
                                                       xlab = "6-dimensional motivation system",
                                                       ylab = "6-dimensional motivation system")))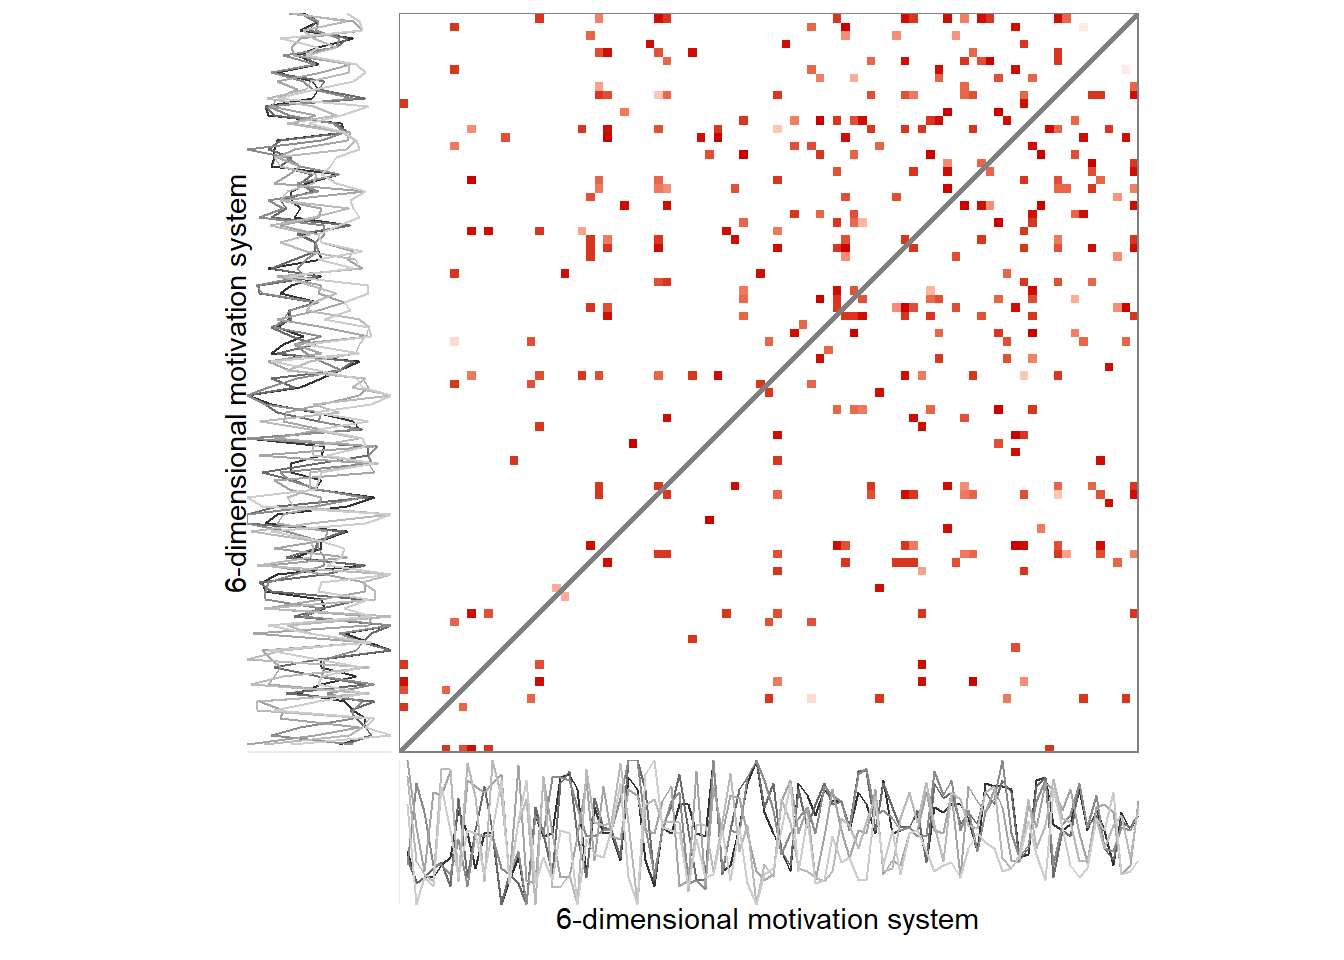
# Make node size equal to strength. Strength is the sum of a node's edge weights.
for (i in 1:nrow(emadata_nested_wrangled_both_recnets)) {
igraph::V(emadata_nested_wrangled_both_recnets$graph_from_adjacency[[i]])$size <- (igraph::strength(emadata_nested_wrangled_both_recnets$graph_from_adjacency[[i]]))
}

# Rescaling weight as "width"; varies between 5 and 10
for (i in 1:nrow(emadata_nested_wrangled_both_recnets)) {
igraph::E(emadata_nested_wrangled_both_recnets$graph_from_adjacency[[i]])$width <-
  casnet::elascer(igraph::E(emadata_nested_wrangled_both_recnets$graph_from_adjacency[[i]])$weight, lo = 5, hi = 10)
}
The lengthy code chunk below extracts and marks attractors in the data.
# Get number of maximally connected node
emadata_nested_wrangled_both_recnets_nodes <- emadata_nested_wrangled_both_recnets %>%
dplyr::mutate(strongest_day = purrr::map(.x = graph_from_adjacency,
.f = ~which.max(igraph::strength(.x))
))
emadata_nested_wrangled_both_recnets_nodes <- emadata_nested_wrangled_both_recnets_nodes %>%
dplyr::mutate(list_of_edges = purrr::map(.x = graph_from_adjacency,
.f = ~igraph::get.data.frame(.x)
))
emadata_nested_wrangled_both_recnets_nodes <- emadata_nested_wrangled_both_recnets_nodes %>%
dplyr::mutate(all_nodes_with_strengths =
purrr::map2(.x = data_firstlast_divided_by_max,
.y = graph_from_adjacency,
.f = ~{
data.frame(.x,
strength = igraph::strength(.y)) %>%
dplyr::mutate(time = dplyr::row_number()) %>%
tidyr::pivot_longer(cols = c(-strength, -time))
}
))
# Extract nodes (i.e. times) which connect to the strongest (i.e. most connected) node
emadata_nested_wrangled_both_recnets_nodes <- emadata_nested_wrangled_both_recnets_nodes %>%
dplyr::mutate(connecting_to_strongest = purrr::map2(.x = list_of_edges,
.y = strongest_day,
.f = ~{
.x %>% dplyr::filter(from == .y | to == .y) %>%
dplyr::arrange(weight) %>%
tidyr::pivot_longer(cols = c(from, to),
values_to = "node") %>%
dplyr::distinct(node,
#.keep_all = TRUE
) %>%
dplyr::pull(node)
}
)
)
emadata_nested_wrangled_both_recnets_nodes <- emadata_nested_wrangled_both_recnets_nodes %>%
dplyr::mutate(all_nodes_with_strengths = purrr::map2(.x = all_nodes_with_strengths,
.y = connecting_to_strongest,
.f = ~{
dplyr::mutate(.x,
connecting_to_strongest =
dplyr::case_when(time %in% .y ~ TRUE,
TRUE ~ FALSE))
}
))
# Get number of 2nd maximally connected node, which doesn't connect to the 1st
emadata_nested_wrangled_both_recnets_nodes <- emadata_nested_wrangled_both_recnets_nodes %>%
dplyr::mutate(secondary_attractor_day = purrr::map2(.x = graph_from_adjacency,
.y = connecting_to_strongest,
.f = ~{
data.frame(strength = igraph::strength(.x),
time = 1:length(igraph::strength(.x))) %>%
dplyr::filter(!time %in% .y) %>%
dplyr::arrange(desc(strength)) %>%
dplyr::slice(1) %>%
dplyr::pull(time)
}
))
# Extract nodes (i.e. times) which connect to the 2nd strongest node, which doesn't connect to the 1st
emadata_nested_wrangled_both_recnets_nodes <- emadata_nested_wrangled_both_recnets_nodes %>%
dplyr::mutate(connecting_to_2nd_strongest = purrr::map2(.x = list_of_edges,
.y = secondary_attractor_day,
.f = ~{
.x %>% dplyr::filter(from == .y | to == .y) %>%
dplyr::arrange(weight) %>%
tidyr::pivot_longer(cols = c(from, to),
values_to = "node") %>%
dplyr::distinct(node,
#.keep_all = TRUE
) %>%
dplyr::pull(node)
}
)
)
# Save as a variable in the dataset
emadata_nested_wrangled_both_recnets_nodes <- emadata_nested_wrangled_both_recnets_nodes %>%
dplyr::mutate(all_nodes_with_strengths = purrr::map2(.x = all_nodes_with_strengths,
.y = connecting_to_2nd_strongest,
.f = ~{
dplyr::mutate(.x,
connecting_to_2nd_strongest =
dplyr::case_when(time %in% .y ~ TRUE,
TRUE ~ FALSE))
}
))
# Get number of 3rd maximally connected node, which doesn't connect to the 1st or second
emadata_nested_wrangled_both_recnets_nodes <- emadata_nested_wrangled_both_recnets_nodes %>%
dplyr::mutate(tertiary_attractor_day = purrr::pmap(list(..1 = graph_from_adjacency,
..2 = connecting_to_strongest,
..3 = connecting_to_2nd_strongest),
.f = ~{
data.frame(strength = igraph::strength(..1),
time = 1:length(igraph::strength(..1))) %>%
dplyr::filter(!time %in% ..2,
!time %in% ..3) %>%
dplyr::arrange(desc(strength)) %>%
dplyr::slice(1) %>%
dplyr::pull(time)
}
))
# Extract nodes (i.e. times) which connect to the 3rd strongest node
emadata_nested_wrangled_both_recnets_nodes <- emadata_nested_wrangled_both_recnets_nodes %>%
dplyr::mutate(connecting_to_3rd_strongest = purrr::map2(.x = list_of_edges,
.y = tertiary_attractor_day,
.f = ~{
.x %>% dplyr::filter(from == .y | to == .y) %>%
dplyr::arrange(weight) %>%
tidyr::pivot_longer(cols = c(from, to),
values_to = "node") %>%
dplyr::distinct(node,
#.keep_all = TRUE
) %>%
dplyr::pull(node)
}
)
)
# Save as a variable
emadata_nested_wrangled_both_recnets_nodes <- emadata_nested_wrangled_both_recnets_nodes %>%
dplyr::mutate(all_nodes_with_strengths = purrr::map2(.x = all_nodes_with_strengths,
.y = connecting_to_3rd_strongest,
.f = ~{
dplyr::mutate(.x,
connecting_to_3rd_strongest =
dplyr::case_when(time %in% .y ~ TRUE,
TRUE ~ FALSE))
}
))
# Get number of 4th maximally connected node, which doesn't connect to the 1st, 2nd, or 3rd
emadata_nested_wrangled_both_recnets_nodes <- emadata_nested_wrangled_both_recnets_nodes %>%
dplyr::mutate(fourth_attractor_day = purrr::pmap(list(..1 = graph_from_adjacency,
..2 = connecting_to_strongest,
..3 = connecting_to_2nd_strongest,
..4 = connecting_to_3rd_strongest),
.f = ~{
data.frame(strength = igraph::strength(..1),
time = 1:length(igraph::strength(..1))) %>%
dplyr::filter(!time %in% ..2,
!time %in% ..3,
!time %in% ..4) %>%
dplyr::arrange(desc(strength)) %>%
dplyr::slice(1) %>%
dplyr::pull(time)
}
))
# Extract nodes (i.e. times) which connect to the 4th strongest node
emadata_nested_wrangled_both_recnets_nodes <- emadata_nested_wrangled_both_recnets_nodes %>%
dplyr::mutate(connecting_to_4th_strongest = purrr::map2(.x = list_of_edges,
.y = fourth_attractor_day,
.f = ~{
.x %>% dplyr::filter(from == .y | to == .y) %>%
dplyr::arrange(weight) %>%
tidyr::pivot_longer(cols = c(from, to),
values_to = "node") %>%
dplyr::distinct(node,
#.keep_all = TRUE
) %>%
dplyr::pull(node)
}
)
)
# Save as a variable
emadata_nested_wrangled_both_recnets_nodes <- emadata_nested_wrangled_both_recnets_nodes %>%
dplyr::mutate(all_nodes_with_strengths = purrr::map2(.x = all_nodes_with_strengths,
.y = connecting_to_4th_strongest,
.f = ~{
dplyr::mutate(.x,
connecting_to_4th_strongest =
dplyr::case_when(time %in% .y ~ TRUE,
TRUE ~ FALSE))
}
))
################### Make plots
emadata_nested_wrangled_both_recnets_nodes_plots <- emadata_nested_wrangled_both_recnets_nodes %>%
dplyr::mutate(all_nodes_with_strengths =
purrr::map(.x = all_nodes_with_strengths,
.f = ~{
dplyr::mutate(.x,
attractors = dplyr::case_when(
strength == 0 ~ "Unique",
connecting_to_strongest == TRUE ~ "1st",
connecting_to_2nd_strongest == TRUE ~ "2nd",
connecting_to_3rd_strongest == TRUE ~ "3rd",
connecting_to_4th_strongest == TRUE ~ "4th",
TRUE ~ "Uncategorised"),
attractors = factor(attractors,
levels = c("1st",
"2nd",
"3rd",
"4th",
"Uncategorised",
"Unique")),
name = factor(name,
levels = c("pleasure",
"interest",
"importance",
"situation_requires",
"anxiety_guilt_avoidance",
"another_wants"),
labels = c("Pleasure",
"Interest",
"Importance",
"Situation requires",
"Anxiety guilt avoidance",
"Another wants")) %>%
forcats::fct_drop()) %>%
dplyr::group_by(attractors, name) %>%
dplyr::mutate(n = n()) %>%
dplyr::ungroup() %>%
dplyr::mutate(maxtime = max(time),
percentage_of_total =
(n / maxtime) %>% scales::percent(accuracy = 0.1),
proportion_of_total = n/maxtime,
attractors_n =
factor(paste0(attractors,
" (n = ", n, "; ",
percentage_of_total, ")")))
}
))Spiral graph with colored nodes
emadata_nested_wrangled_both_recnets_nodes_plots <- emadata_nested_wrangled_both_recnets_nodes_plots %>%
  dplyr::mutate(node_colors = purrr::map(.x = all_nodes_with_strengths,
                                         .f = ~{tidyr::pivot_wider(.x, names_from = name) %>%
                                             dplyr::pull(attractors)}))

for (i in 1:nrow(emadata_nested_wrangled_both_recnets_nodes_plots)) {
levels(emadata_nested_wrangled_both_recnets_nodes_plots$node_colors[[i]]) <-
  c(viridisLite::plasma(4,
                      end = 0.8,
                      direction = -1), "gray48", "white")
  }

emadata_nested_wrangled_both_recnets_nodes_plots <- emadata_nested_wrangled_both_recnets_nodes_plots %>%
  dplyr::mutate(spiralgraph_epochs = purrr::pmap(list(..1 = graph_from_adjacency,
                                          ..2 = node_colors,
                                          ..3 = User),
                                     .f =  ~casnet::make_spiral_graph(g = ..1,
                                                                      arcs = 4,
                                                                      # a = .1,
                                                                      # b = 2,
                                                                      markTimeBy = TRUE,
                                                                      markEpochsBy = ..2,
                                                                      epochColours = ..2,
                                                                      showEpochLegend = FALSE,
                                                                      scaleEdgeSize = 1/10,
                                                                      scaleVertexSize = c(1, 5),
                                                                      showSizeLegend = FALSE,
                                                                      sizeLabel = "Node strength",
                                                                      type = "Euler",
                                                                      # alphaE = 0.1
                                                                      # title = ..3
                                     )))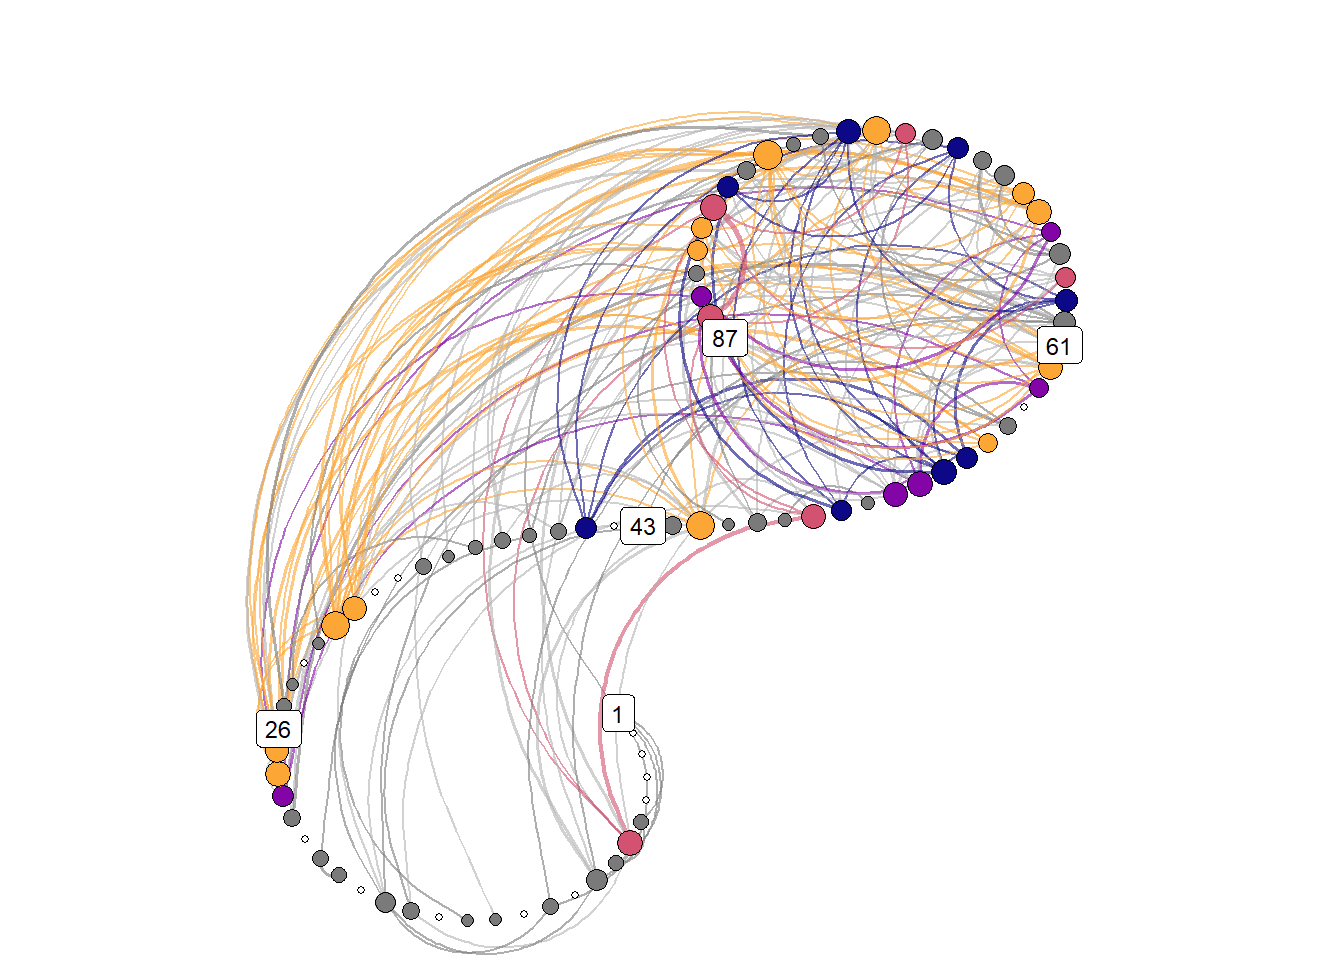
# emadata_nested_wrangled_both_recnets_nodes_plots$spiralgraph_epochs[[1]] +
#   theme(plot.margin=grid::unit(c(0,0,0,0), "mm"))

# ggsave(filename = "./figures/recnetwork.png",
#        width = 7,
#        height = 7)

# emadata_nested_wrangled_both_recnets_nodes_plots$all_nodes_with_strengths[[1]]
Attractor plot
emadata_nested_wrangled_both_recnets_nodes_plots <- emadata_nested_wrangled_both_recnets_nodes_plots %>%
  dplyr::mutate(observations = purrr::map_dbl(.x = data_firstlast_divided_by_max,
                                              .f = ~nrow(.)))

emadata_nested_wrangled_both_recnets_nodes_plots <- emadata_nested_wrangled_both_recnets_nodes_plots %>%
  dplyr::mutate(observations_daily = purrr::map_dbl(.x = data_daily,
                                              .f = ~nrow(.)))


emadata_nested_wrangled_both_recnets_nodes_plots <- emadata_nested_wrangled_both_recnets_nodes_plots %>%
  dplyr::mutate(
    attractor_plots =
      purrr::pmap(list(..1 = all_nodes_with_strengths,
                       ..2 = observations,
                       ..3 = observations_daily,
                       ..4 = User),
                  .f = ~{
                    dplyr::mutate(..1,
                                  strength_rescaled =
                                    scales::rescale(strength, to = c(0.3, 1.1)),
                                  alpha_strength = ifelse(strength_rescaled == 0.3,
                                                          0.5,
                                                          strength_rescaled)) %>%
                      ggplot(data = .,
                             aes(x = forcats::fct_rev(name),
                                 y = value,
                                 size = strength_rescaled,
                                 alpha = alpha_strength,
                                 color = attractors_n)) +
                      scale_size_identity() +
                      scale_alpha_identity() +
                      geom_point(aes(alpha = alpha_strength)) +
                      geom_line(aes(group = time,
                                    alpha = alpha_strength)) +
                      scale_color_manual(values = c(viridisLite::plasma(4,
                                                                        end = 0.8,
                                                                        direction = -1),
                                                    "gray40", "gray50")) +
                      scale_y_continuous(labels = scales::label_percent(accuracy = 1)) +
                      theme_bw() +
                      theme(legend.position = "none") +
                      labs(y = "Percentage of maximum reported value of variable, across full time series",
                           x = NULL,
                           title = paste0("Participant \"", ..4, "\" - based on ", ..2, " data points (", ..3, " days)"),
                           caption = paste0("Recurrence rate used for the analysis: ", scales::percent(recurrence_rate))) +
                      facet_wrap(~attractors_n) +
                      coord_flip(ylim = c(0, 1))
                  }
      ))

emadata_nested_wrangled_both_recnets_nodes_plots$attractor_plots[[1]]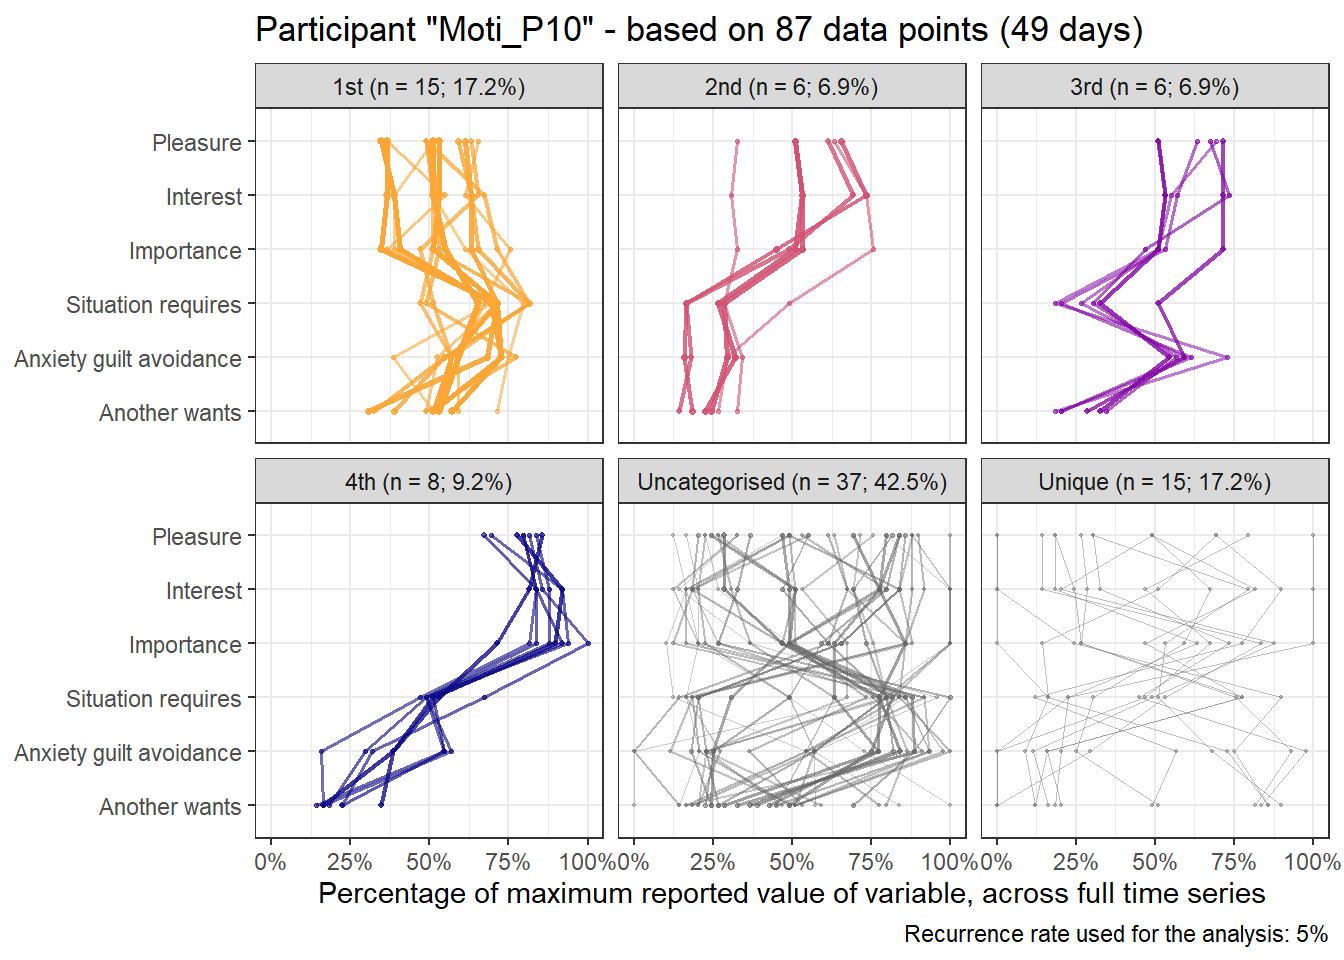
# emadata_nested_wrangled_both_recnets_nodes_plots$all_nodes_with_strengths[[1]]

# # Save this to be used for the task analysis later; otherwise overwritten by sensitivity analyses:
# firstlast_emadata_nested_wrangled_both_recnets_nodes_plots <-
#   emadata_nested_wrangled_both_recnets_nodes_plots

# cowplot::save_plot("./figures/attractors.png",
#                    emadata_nested_wrangled_both_recnets_nodes_plots$attractor_plots[[1]],
#                    dpi = 300,
#                    base_height = 11.69/2)
1. Single randomly sampled daily observation
Here’s the 6-dimensional motivation system’s recurrence plot, weighted by similarity.
set.seed(100)

#######################

# si = similarity under the radius
emadata_nested_wrangled_both_recnets <- emadata_nested_wrangled %>%
  dplyr::mutate(RN = purrr::map(.x = sample1_standardised,
                                .f =  ~casnet::rn(.x %>% dplyr::select(#autonomy, competence, relatedness,
                                                                       pleasure, interest, importance,
                                                                       situation_requires,
                                                                       anxiety_guilt_avoidance,
                                                                       another_wants),
                                                  doEmbed = FALSE,
                                                  weighted = TRUE,
                                                  weightedBy = "si",
                                                  emRad = NA)))
##
## Auto-recurrence: Setting diagonal to (1 + max. distance) for analyses
##
## Searching for a radius that will yield 0.05 for RR

emadata_nested_wrangled_both_recnets <- emadata_nested_wrangled_both_recnets %>%
  dplyr::mutate(graph_from_adjacency = purrr::map(.x = RN,
                                                  .f = ~igraph::graph_from_adjacency_matrix(.x,
                                                                                            weighted = TRUE,
                                                                                            mode = "upper",
                                                                                            diag = FALSE)))

# Edges with their distances
emadata_nested_wrangled_both_recnets <- emadata_nested_wrangled_both_recnets %>%
  dplyr::mutate(edges_with_distances = purrr::map(.x = graph_from_adjacency,
                                                  .f = ~igraph::E(.x)$weight),
                graph_from_adjacency_orig = graph_from_adjacency)

# Larger values are closer to the state; inverse of weight makes it more intuitive
for (i in 1:nrow(emadata_nested_wrangled_both_recnets)) {
igraph::E(emadata_nested_wrangled_both_recnets$graph_from_adjacency[[i]])$weight <- (1/emadata_nested_wrangled_both_recnets$edges_with_distances[[i]])
}
# A later note to self: Now weight is a measure of distance; how far apart two time points are
# (under the radius, i.e. they're reasonably similar to begin with)

####### To check:
# igraph::E(emadata_nested_wrangled_both_recnets$graph_from_adjacency[[1]])$weight
# igraph::E(emadata_nested_wrangled_both_recnets$graph_from_adjacency_orig[[1]])$weight

emadata_nested_wrangled_both_recnets <- emadata_nested_wrangled_both_recnets %>%
  dplyr::mutate(RN_plot = purrr::map(.x = RN,
                                .f =  ~casnet::rn_plot(.x,
                                                       plotDimensions = TRUE,
                                                       xlab = "6-dimensional motivation system",
                                                       ylab = "6-dimensional motivation system")))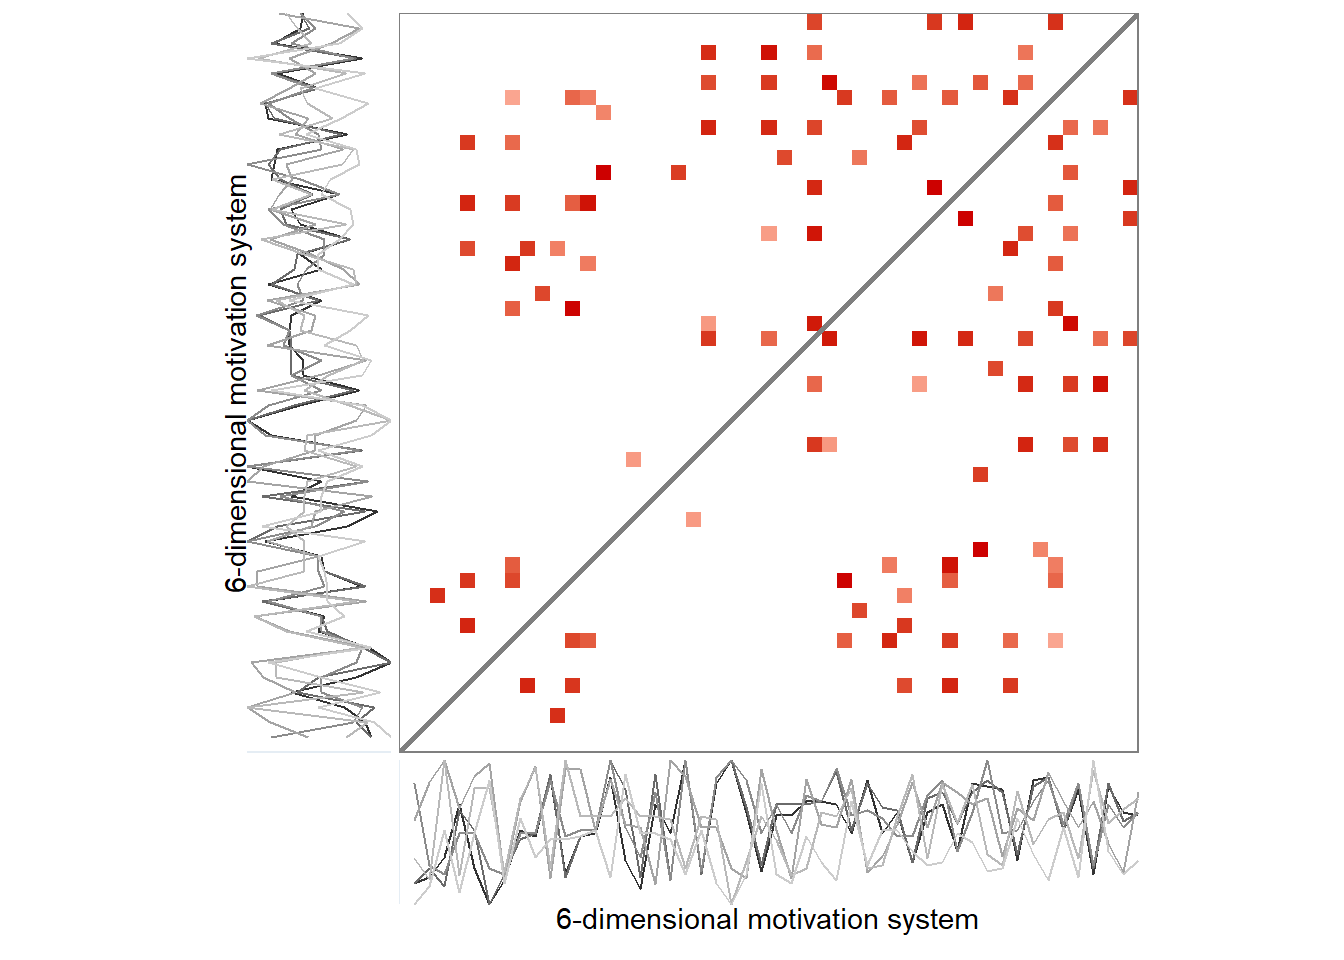
# Make node size equal to strength. Strength is the sum of a node's edge weights.
for (i in 1:nrow(emadata_nested_wrangled_both_recnets)) {
igraph::V(emadata_nested_wrangled_both_recnets$graph_from_adjacency[[i]])$size <- (igraph::strength(emadata_nested_wrangled_both_recnets$graph_from_adjacency[[i]]))
}

# Rescaling weight as "width"; varies between 5 and 10
for (i in 1:nrow(emadata_nested_wrangled_both_recnets)) {
igraph::E(emadata_nested_wrangled_both_recnets$graph_from_adjacency[[i]])$width <-
  casnet::elascer(igraph::E(emadata_nested_wrangled_both_recnets$graph_from_adjacency[[i]])$weight, lo = 5, hi = 10)
}
The lengthy code chunk below extracts and marks attractors in the data.
# Get number of maximally connected node
emadata_nested_wrangled_both_recnets_nodes <- emadata_nested_wrangled_both_recnets %>%
dplyr::mutate(strongest_day = purrr::map(.x = graph_from_adjacency,
.f = ~which.max(igraph::strength(.x))
))
emadata_nested_wrangled_both_recnets_nodes <- emadata_nested_wrangled_both_recnets_nodes %>%
dplyr::mutate(list_of_edges = purrr::map(.x = graph_from_adjacency,
.f = ~igraph::get.data.frame(.x)
))
emadata_nested_wrangled_both_recnets_nodes <- emadata_nested_wrangled_both_recnets_nodes %>%
dplyr::mutate(all_nodes_with_strengths =
purrr::map2(.x = sample1_standardised,
.y = graph_from_adjacency,
.f = ~{
data.frame(.x %>%
dplyr::select(#autonomy, competence, relatedness,
pleasure, interest, importance,
situation_requires, anxiety_guilt_avoidance, another_wants),
strength = igraph::strength(.y)) %>%
dplyr::mutate(time = dplyr::row_number()) %>%
tidyr::pivot_longer(cols = c(-strength, -time))
}
))
# Extract nodes (i.e. times) which connect to the strongest (i.e. most connected) node
emadata_nested_wrangled_both_recnets_nodes <- emadata_nested_wrangled_both_recnets_nodes %>%
dplyr::mutate(connecting_to_strongest = purrr::map2(.x = list_of_edges,
.y = strongest_day,
.f = ~{
.x %>% dplyr::filter(from == .y | to == .y) %>%
dplyr::arrange(weight) %>%
tidyr::pivot_longer(cols = c(from, to),
values_to = "node") %>%
dplyr::distinct(node,
#.keep_all = TRUE
) %>%
dplyr::pull(node)
}
)
)
emadata_nested_wrangled_both_recnets_nodes <- emadata_nested_wrangled_both_recnets_nodes %>%
dplyr::mutate(all_nodes_with_strengths = purrr::map2(.x = all_nodes_with_strengths,
.y = connecting_to_strongest,
.f = ~{
dplyr::mutate(.x,
connecting_to_strongest =
dplyr::case_when(time %in% .y ~ TRUE,
TRUE ~ FALSE))
}
))
# Get number of 2nd maximally connected node, which doesn't connect to the 1st
emadata_nested_wrangled_both_recnets_nodes <- emadata_nested_wrangled_both_recnets_nodes %>%
dplyr::mutate(secondary_attractor_day = purrr::map2(.x = graph_from_adjacency,
.y = connecting_to_strongest,
.f = ~{
data.frame(strength = igraph::strength(.x),
time = 1:length(igraph::strength(.x))) %>%
dplyr::filter(!time %in% .y) %>%
dplyr::arrange(desc(strength)) %>%
dplyr::slice(1) %>%
dplyr::pull(time)
}
))
# Extract nodes (i.e. times) which connect to the 2nd strongest node, which doesn't connect to the 1st
emadata_nested_wrangled_both_recnets_nodes <- emadata_nested_wrangled_both_recnets_nodes %>%
dplyr::mutate(connecting_to_2nd_strongest = purrr::map2(.x = list_of_edges,
.y = secondary_attractor_day,
.f = ~{
.x %>% dplyr::filter(from == .y | to == .y) %>%
dplyr::arrange(weight) %>%
tidyr::pivot_longer(cols = c(from, to),
values_to = "node") %>%
dplyr::distinct(node,
#.keep_all = TRUE
) %>%
dplyr::pull(node)
}
)
)
# Save as a variable in the dataset
emadata_nested_wrangled_both_recnets_nodes <- emadata_nested_wrangled_both_recnets_nodes %>%
dplyr::mutate(all_nodes_with_strengths = purrr::map2(.x = all_nodes_with_strengths,
.y = connecting_to_2nd_strongest,
.f = ~{
dplyr::mutate(.x,
connecting_to_2nd_strongest =
dplyr::case_when(time %in% .y ~ TRUE,
TRUE ~ FALSE))
}
))
# Get number of 3rd maximally connected node, which doesn't connect to the 1st or second
emadata_nested_wrangled_both_recnets_nodes <- emadata_nested_wrangled_both_recnets_nodes %>%
dplyr::mutate(tertiary_attractor_day = purrr::pmap(list(..1 = graph_from_adjacency,
..2 = connecting_to_strongest,
..3 = connecting_to_2nd_strongest),
.f = ~{
data.frame(strength = igraph::strength(..1),
time = 1:length(igraph::strength(..1))) %>%
dplyr::filter(!time %in% ..2,
!time %in% ..3) %>%
dplyr::arrange(desc(strength)) %>%
dplyr::slice(1) %>%
dplyr::pull(time)
}
))
# Extract nodes (i.e. times) which connect to the 3rd strongest node
emadata_nested_wrangled_both_recnets_nodes <- emadata_nested_wrangled_both_recnets_nodes %>%
dplyr::mutate(connecting_to_3rd_strongest = purrr::map2(.x = list_of_edges,
.y = tertiary_attractor_day,
.f = ~{
.x %>% dplyr::filter(from == .y | to == .y) %>%
dplyr::arrange(weight) %>%
tidyr::pivot_longer(cols = c(from, to),
values_to = "node") %>%
dplyr::distinct(node,
#.keep_all = TRUE
) %>%
dplyr::pull(node)
}
)
)
# Save as a variable
emadata_nested_wrangled_both_recnets_nodes <- emadata_nested_wrangled_both_recnets_nodes %>%
dplyr::mutate(all_nodes_with_strengths = purrr::map2(.x = all_nodes_with_strengths,
.y = connecting_to_3rd_strongest,
.f = ~{
dplyr::mutate(.x,
connecting_to_3rd_strongest =
dplyr::case_when(time %in% .y ~ TRUE,
TRUE ~ FALSE))
}
))
# Get number of 4th maximally connected node, which doesn't connect to the 1st, 2nd, or 3rd
emadata_nested_wrangled_both_recnets_nodes <- emadata_nested_wrangled_both_recnets_nodes %>%
dplyr::mutate(fourth_attractor_day = purrr::pmap(list(..1 = graph_from_adjacency,
..2 = connecting_to_strongest,
..3 = connecting_to_2nd_strongest,
..4 = connecting_to_3rd_strongest),
.f = ~{
data.frame(strength = igraph::strength(..1),
time = 1:length(igraph::strength(..1))) %>%
dplyr::filter(!time %in% ..2,
!time %in% ..3,
!time %in% ..4) %>%
dplyr::arrange(desc(strength)) %>%
dplyr::slice(1) %>%
dplyr::pull(time)
}
))
# Extract nodes (i.e. times) which connect to the 4th strongest node
emadata_nested_wrangled_both_recnets_nodes <- emadata_nested_wrangled_both_recnets_nodes %>%
dplyr::mutate(connecting_to_4th_strongest = purrr::map2(.x = list_of_edges,
.y = fourth_attractor_day,
.f = ~{
.x %>% dplyr::filter(from == .y | to == .y) %>%
dplyr::arrange(weight) %>%
tidyr::pivot_longer(cols = c(from, to),
values_to = "node") %>%
dplyr::distinct(node,
#.keep_all = TRUE
) %>%
dplyr::pull(node)
}
)
)
# Save as a variable
emadata_nested_wrangled_both_recnets_nodes <- emadata_nested_wrangled_both_recnets_nodes %>%
dplyr::mutate(all_nodes_with_strengths = purrr::map2(.x = all_nodes_with_strengths,
.y = connecting_to_4th_strongest,
.f = ~{
dplyr::mutate(.x,
connecting_to_4th_strongest =
dplyr::case_when(time %in% .y ~ TRUE,
TRUE ~ FALSE))
}
))
################### Make plots
emadata_nested_wrangled_both_recnets_nodes_plots <- emadata_nested_wrangled_both_recnets_nodes %>%
dplyr::mutate(all_nodes_with_strengths =
purrr::map(.x = all_nodes_with_strengths,
.f = ~{
dplyr::mutate(.x,
attractors = dplyr::case_when(
strength == 0 ~ "Unique",
connecting_to_strongest == TRUE ~ "1st",
connecting_to_2nd_strongest == TRUE ~ "2nd",
connecting_to_3rd_strongest == TRUE ~ "3rd",
connecting_to_4th_strongest == TRUE ~ "4th",
TRUE ~ "Uncategorised"),
attractors = factor(attractors,
levels = c("1st",
"2nd",
"3rd",
"4th",
"Uncategorised",
"Unique")),
name = factor(name,
levels = c("pleasure",
"interest",
"importance",
"situation_requires",
"anxiety_guilt_avoidance",
"another_wants"),
labels = c("Pleasure",
"Interest",
"Importance",
"Situation requires",
"Anxiety guilt avoidance",
"Another wants")) %>%
forcats::fct_drop()) %>%
dplyr::group_by(attractors, name) %>%
dplyr::mutate(n = n()) %>%
dplyr::ungroup() %>%
dplyr::mutate(maxtime = max(time),
percentage_of_total =
(n / maxtime) %>% scales::percent(accuracy = 0.1),
proportion_of_total = n/maxtime,
attractors_n =
factor(paste0(attractors,
" (n = ", n, "; ",
percentage_of_total, ")")))
}
))Spiral graph with colored nodes
emadata_nested_wrangled_both_recnets_nodes_plots <- emadata_nested_wrangled_both_recnets_nodes_plots %>%
  dplyr::mutate(node_colors = purrr::map(.x = all_nodes_with_strengths,
                                         .f = ~{tidyr::pivot_wider(.x, names_from = name) %>%
                                             dplyr::pull(attractors)}))

for (i in 1:nrow(emadata_nested_wrangled_both_recnets_nodes_plots)) {
levels(emadata_nested_wrangled_both_recnets_nodes_plots$node_colors[[i]]) <-
  c(viridisLite::plasma(4,
                      end = 0.8,
                      direction = -1), "gray48", "white")
  }

emadata_nested_wrangled_both_recnets_nodes_plots <- emadata_nested_wrangled_both_recnets_nodes_plots %>%
  dplyr::mutate(spiralgraph_epochs = purrr::pmap(list(..1 = graph_from_adjacency,
                                          ..2 = node_colors,
                                          ..3 = User),
                                     .f =  ~casnet::make_spiral_graph(g = ..1,
                                                                      arcs = 4,
                                                                      # a = .1,
                                                                      # b = 2,
                                                                      markTimeBy = TRUE,
                                                                      markEpochsBy = ..2,
                                                                      epochColours = ..2,
                                                                      showEpochLegend = FALSE,
                                                                      scaleEdgeSize = 1/10,
                                                                      scaleVertexSize = c(1, 5),
                                                                      showSizeLegend = FALSE,
                                                                      sizeLabel = "Node strength",
                                                                      type = "Euler",
                                                                      # alphaE = 0.1
                                                                      # title = ..3
                                     )))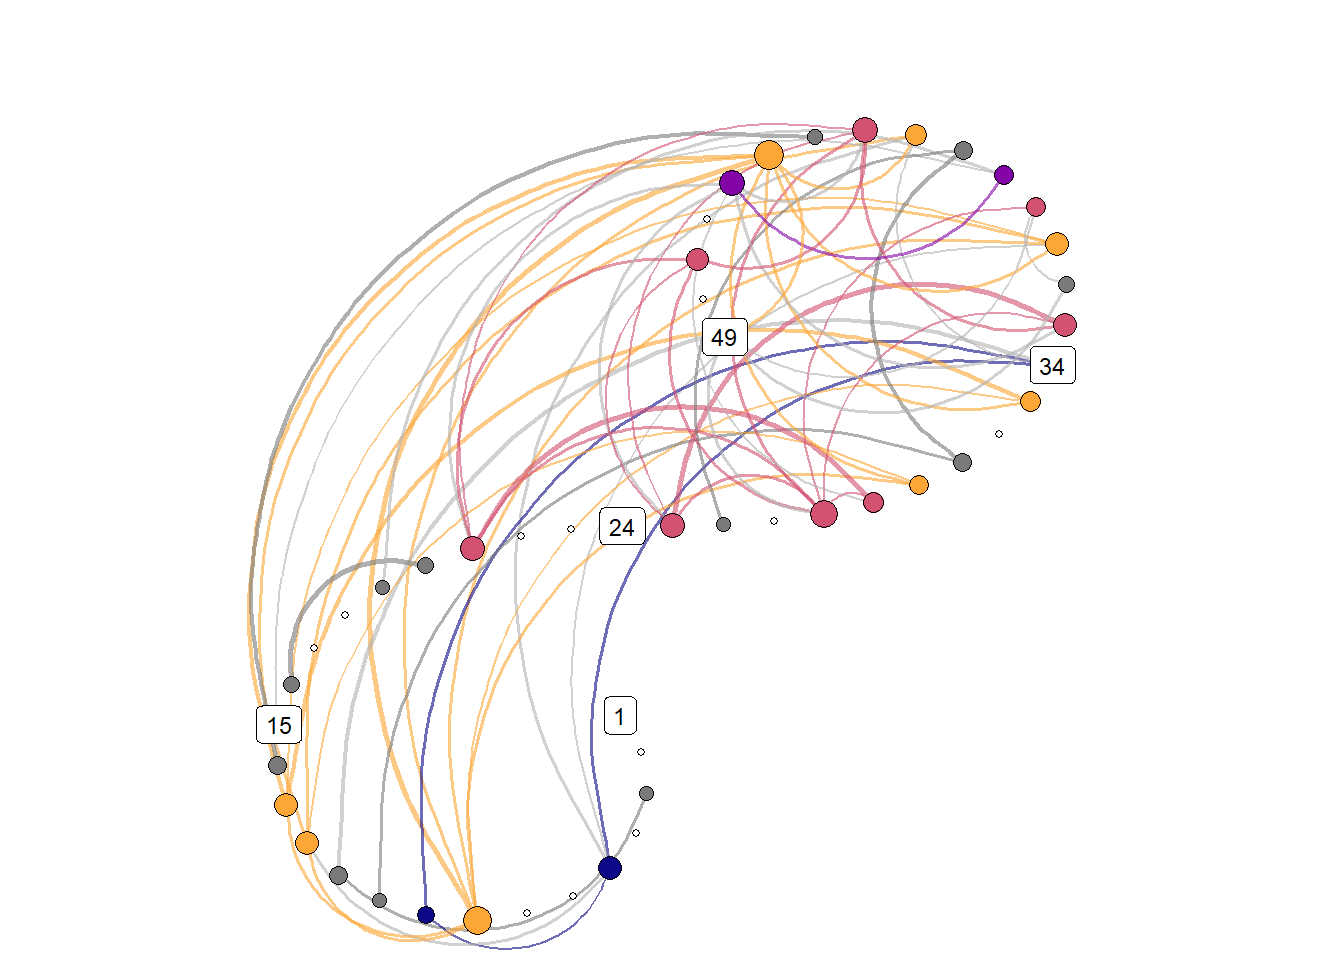
# emadata_nested_wrangled_both_recnets_nodes_plots$spiralgraph_epochs[[1]] +
#   theme(plot.margin=grid::unit(c(0,0,0,0), "mm"))

# ggsave(filename = "./figures/recnetwork.png",
#        width = 7,
#        height = 7)

# emadata_nested_wrangled_both_recnets_nodes_plots$all_nodes_with_strengths[[1]]
Attractor plot
emadata_nested_wrangled_both_recnets_nodes_plots <- emadata_nested_wrangled_both_recnets_nodes_plots %>%
  dplyr::mutate(observations = purrr::map_dbl(.x = sample1_standardised,
                                              .f = ~nrow(.)))

emadata_nested_wrangled_both_recnets_nodes_plots <- emadata_nested_wrangled_both_recnets_nodes_plots %>%
  dplyr::mutate(observations_daily = purrr::map_dbl(.x = data_daily,
                                              .f = ~nrow(.)))


emadata_nested_wrangled_both_recnets_nodes_plots <- emadata_nested_wrangled_both_recnets_nodes_plots %>%
  dplyr::mutate(
    attractor_plots =
      purrr::pmap(list(..1 = all_nodes_with_strengths,
                       ..2 = observations,
                       ..3 = observations_daily,
                       ..4 = User),
                  .f = ~{
                    dplyr::mutate(..1,
                                  strength_rescaled =
                                    scales::rescale(strength, to = c(0.3, 1.1)),
                                  alpha_strength = ifelse(strength_rescaled == 0.3,
                                                          0.5,
                                                          strength_rescaled)) %>%
                      ggplot(data = .,
                             aes(x = forcats::fct_rev(name),
                                 y = value,
                                 size = strength_rescaled,
                                 alpha = alpha_strength,
                                 color = attractors_n)) +
                      scale_size_identity() +
                      scale_alpha_identity() +
                      geom_point(aes(alpha = alpha_strength)) +
                      geom_line(aes(group = time,
                                    alpha = alpha_strength)) +
                      scale_color_manual(values = c(viridisLite::plasma(4,
                                                                        end = 0.8,
                                                                        direction = -1),
                                                    "gray40", "gray50")) +
                      scale_y_continuous(labels = scales::label_percent(accuracy = 1)) +
                      theme_bw() +
                      theme(legend.position = "none") +
                      labs(y = "Percentage of maximum reported value of variable, across full time series",
                           x = NULL,
                           title = paste0("Participant \"", ..4, "\" - based on ", ..2, " data points (", ..3, " days)")) +
                      facet_wrap(~attractors_n) +
                      coord_flip(ylim = c(0, 1))
                  }
      ))

emadata_nested_wrangled_both_recnets_nodes_plots$attractor_plots[[1]]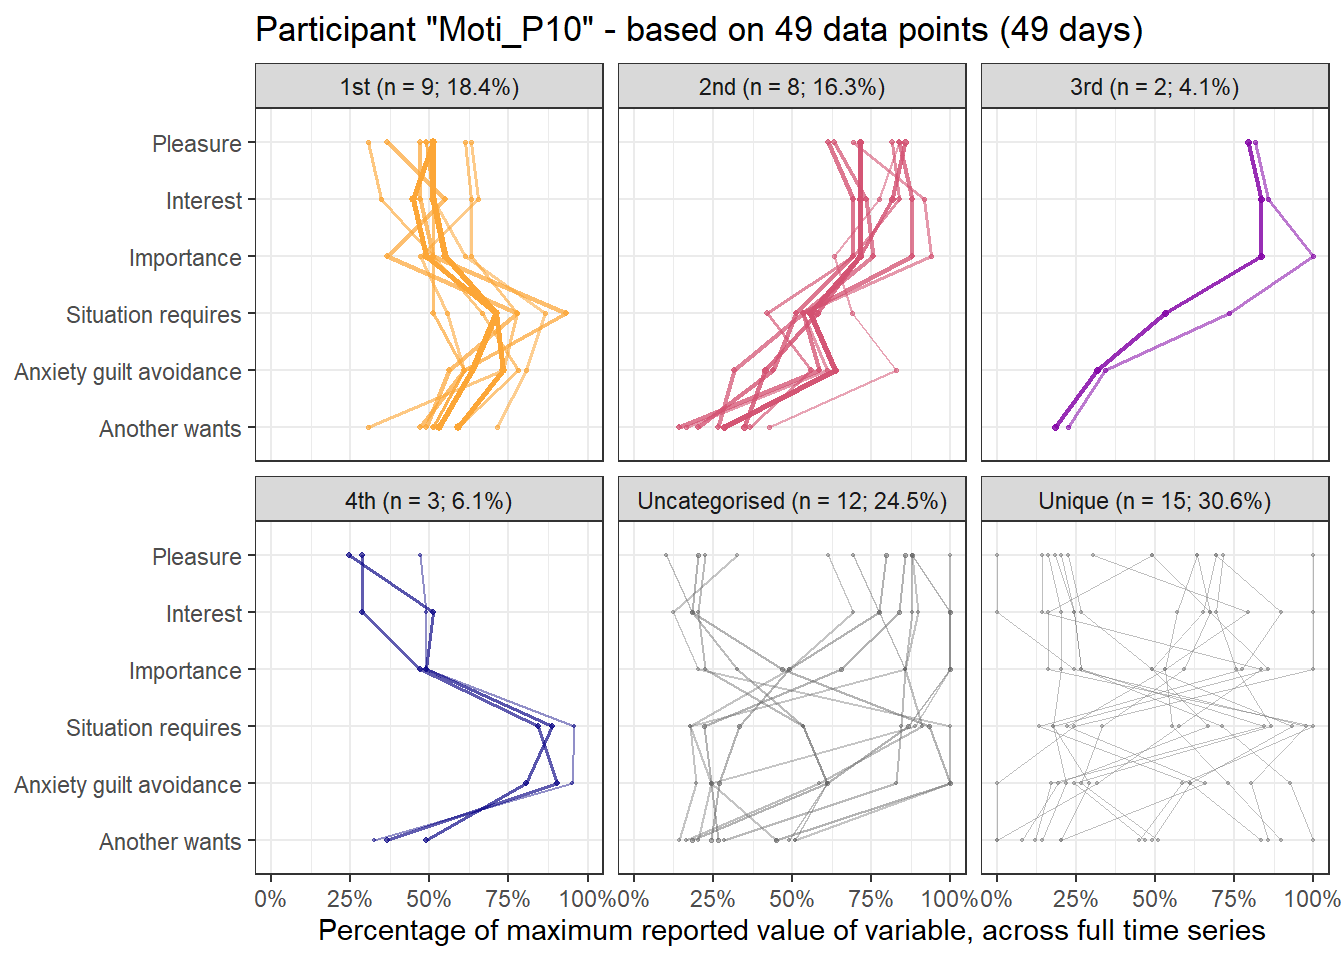
# emadata_nested_wrangled_both_recnets_nodes_plots$all_nodes_with_strengths[[1]]2. Single randomly sampled daily observation
Here’s the 6-dimensional motivation system’s recurrence plot, weighted by similarity.
set.seed(100)

#######################

# si = similarity under the radius
emadata_nested_wrangled_both_recnets <- emadata_nested_wrangled %>%
  dplyr::mutate(RN = purrr::map(.x = sample2_standardised,
                                .f =  ~casnet::rn(.x %>% dplyr::select(#autonomy, competence, relatedness,
                                                                       pleasure, interest, importance,
                                                                       situation_requires,
                                                                       anxiety_guilt_avoidance,
                                                                       another_wants),
                                                  doEmbed = FALSE,
                                                  weighted = TRUE,
                                                  weightedBy = "si",
                                                  emRad = NA)))
##
## Auto-recurrence: Setting diagonal to (1 + max. distance) for analyses
##
## Searching for a radius that will yield 0.05 for RR

emadata_nested_wrangled_both_recnets <- emadata_nested_wrangled_both_recnets %>%
  dplyr::mutate(graph_from_adjacency = purrr::map(.x = RN,
                                                  .f = ~igraph::graph_from_adjacency_matrix(.x,
                                                                                            weighted = TRUE,
                                                                                            mode = "upper",
                                                                                            diag = FALSE)))

# Edges with their distances
emadata_nested_wrangled_both_recnets <- emadata_nested_wrangled_both_recnets %>%
  dplyr::mutate(edges_with_distances = purrr::map(.x = graph_from_adjacency,
                                                  .f = ~igraph::E(.x)$weight),
                graph_from_adjacency_orig = graph_from_adjacency)

# Larger values are closer to the state; inverse of weight makes it more intuitive
for (i in 1:nrow(emadata_nested_wrangled_both_recnets)) {
igraph::E(emadata_nested_wrangled_both_recnets$graph_from_adjacency[[i]])$weight <- (1/emadata_nested_wrangled_both_recnets$edges_with_distances[[i]])
}
# A later note to self: Now weight is a measure of distance; how far apart two time points are
# (under the radius, i.e. they're reasonably similar to begin with)

####### To check:
# igraph::E(emadata_nested_wrangled_both_recnets$graph_from_adjacency[[1]])$weight
# igraph::E(emadata_nested_wrangled_both_recnets$graph_from_adjacency_orig[[1]])$weight

emadata_nested_wrangled_both_recnets <- emadata_nested_wrangled_both_recnets %>%
  dplyr::mutate(RN_plot = purrr::map(.x = RN,
                                .f =  ~casnet::rn_plot(.x,
                                                       plotDimensions = TRUE,
                                                       xlab = "6-dimensional motivation system",
                                                       ylab = "6-dimensional motivation system")))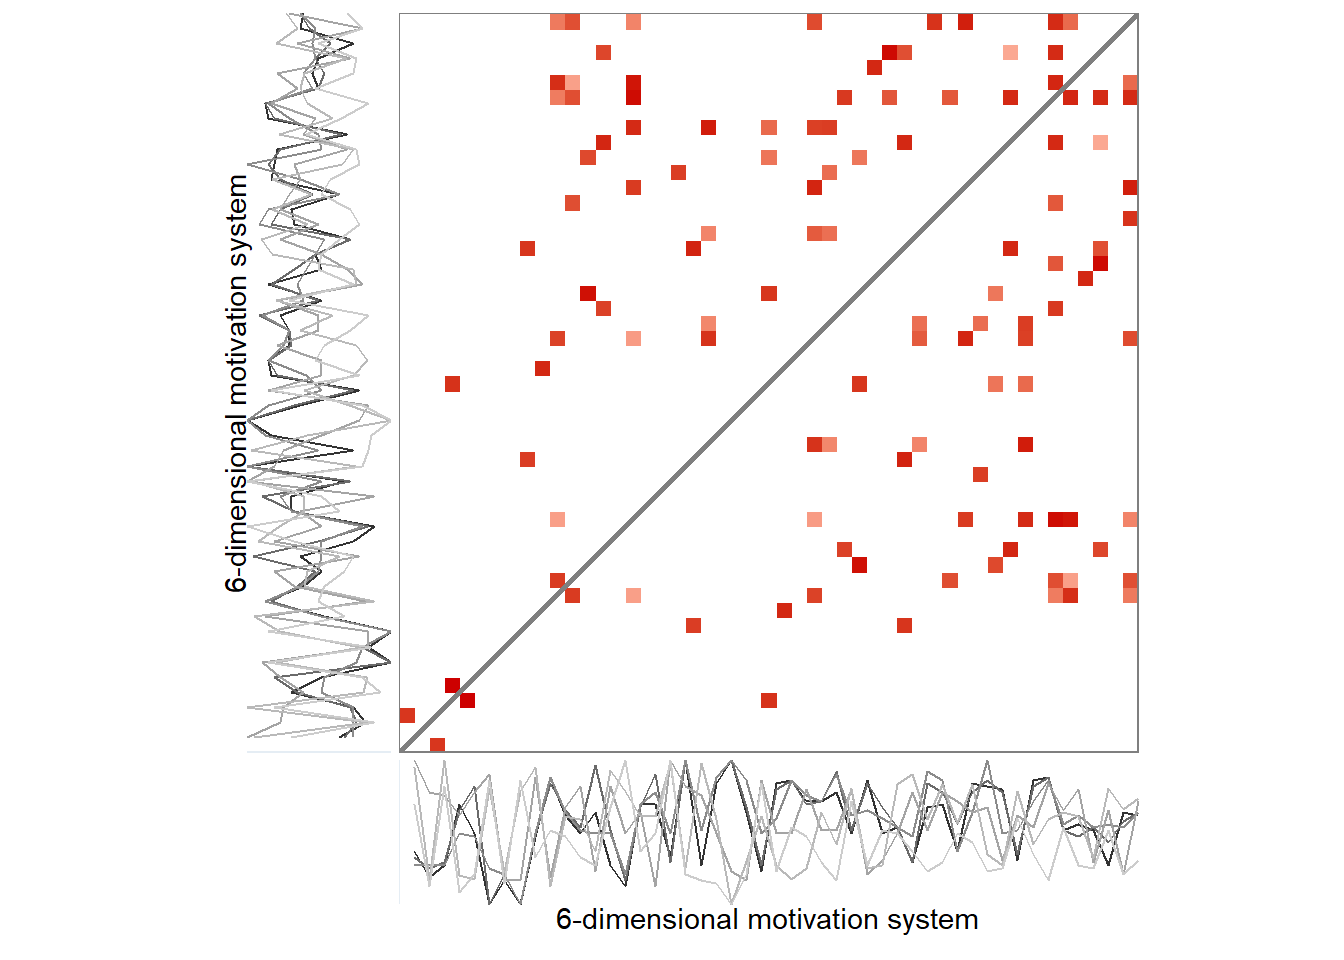
# Make node size equal to strength. Strength is the sum of a node's edge weights.
for (i in 1:nrow(emadata_nested_wrangled_both_recnets)) {
igraph::V(emadata_nested_wrangled_both_recnets$graph_from_adjacency[[i]])$size <- (igraph::strength(emadata_nested_wrangled_both_recnets$graph_from_adjacency[[i]]))
}

# Rescaling weight as "width"; varies between 5 and 10
for (i in 1:nrow(emadata_nested_wrangled_both_recnets)) {
igraph::E(emadata_nested_wrangled_both_recnets$graph_from_adjacency[[i]])$width <-
  casnet::elascer(igraph::E(emadata_nested_wrangled_both_recnets$graph_from_adjacency[[i]])$weight, lo = 5, hi = 10)
}
The lengthy code chunk below extracts and marks attractors in the data.
# Get number of maximally connected node
emadata_nested_wrangled_both_recnets_nodes <- emadata_nested_wrangled_both_recnets %>%
dplyr::mutate(strongest_day = purrr::map(.x = graph_from_adjacency,
.f = ~which.max(igraph::strength(.x))
))
emadata_nested_wrangled_both_recnets_nodes <- emadata_nested_wrangled_both_recnets_nodes %>%
dplyr::mutate(list_of_edges = purrr::map(.x = graph_from_adjacency,
.f = ~igraph::get.data.frame(.x)
))
emadata_nested_wrangled_both_recnets_nodes <- emadata_nested_wrangled_both_recnets_nodes %>%
dplyr::mutate(all_nodes_with_strengths =
purrr::map2(.x = sample2_standardised,
.y = graph_from_adjacency,
.f = ~{
data.frame(.x %>%
dplyr::select(#autonomy, competence, relatedness,
pleasure, interest, importance,
situation_requires, anxiety_guilt_avoidance, another_wants),
strength = igraph::strength(.y)) %>%
dplyr::mutate(time = dplyr::row_number()) %>%
tidyr::pivot_longer(cols = c(-strength, -time))
}
))
# Extract nodes (i.e. times) which connect to the strongest (i.e. most connected) node
emadata_nested_wrangled_both_recnets_nodes <- emadata_nested_wrangled_both_recnets_nodes %>%
dplyr::mutate(connecting_to_strongest = purrr::map2(.x = list_of_edges,
.y = strongest_day,
.f = ~{
.x %>% dplyr::filter(from == .y | to == .y) %>%
dplyr::arrange(weight) %>%
tidyr::pivot_longer(cols = c(from, to),
values_to = "node") %>%
dplyr::distinct(node,
#.keep_all = TRUE
) %>%
dplyr::pull(node)
}
)
)
emadata_nested_wrangled_both_recnets_nodes <- emadata_nested_wrangled_both_recnets_nodes %>%
dplyr::mutate(all_nodes_with_strengths = purrr::map2(.x = all_nodes_with_strengths,
.y = connecting_to_strongest,
.f = ~{
dplyr::mutate(.x,
connecting_to_strongest =
dplyr::case_when(time %in% .y ~ TRUE,
TRUE ~ FALSE))
}
))
# Get number of 2nd maximally connected node, which doesn't connect to the 1st
emadata_nested_wrangled_both_recnets_nodes <- emadata_nested_wrangled_both_recnets_nodes %>%
dplyr::mutate(secondary_attractor_day = purrr::map2(.x = graph_from_adjacency,
.y = connecting_to_strongest,
.f = ~{
data.frame(strength = igraph::strength(.x),
time = 1:length(igraph::strength(.x))) %>%
dplyr::filter(!time %in% .y) %>%
dplyr::arrange(desc(strength)) %>%
dplyr::slice(1) %>%
dplyr::pull(time)
}
))
# Extract nodes (i.e. times) which connect to the 2nd strongest node, which doesn't connect to the 1st
emadata_nested_wrangled_both_recnets_nodes <- emadata_nested_wrangled_both_recnets_nodes %>%
dplyr::mutate(connecting_to_2nd_strongest = purrr::map2(.x = list_of_edges,
.y = secondary_attractor_day,
.f = ~{
.x %>% dplyr::filter(from == .y | to == .y) %>%
dplyr::arrange(weight) %>%
tidyr::pivot_longer(cols = c(from, to),
values_to = "node") %>%
dplyr::distinct(node,
#.keep_all = TRUE
) %>%
dplyr::pull(node)
}
)
)
# Save as a variable in the dataset
emadata_nested_wrangled_both_recnets_nodes <- emadata_nested_wrangled_both_recnets_nodes %>%
dplyr::mutate(all_nodes_with_strengths = purrr::map2(.x = all_nodes_with_strengths,
.y = connecting_to_2nd_strongest,
.f = ~{
dplyr::mutate(.x,
connecting_to_2nd_strongest =
dplyr::case_when(time %in% .y ~ TRUE,
TRUE ~ FALSE))
}
))
# Get number of 3rd maximally connected node, which doesn't connect to the 1st or second
emadata_nested_wrangled_both_recnets_nodes <- emadata_nested_wrangled_both_recnets_nodes %>%
dplyr::mutate(tertiary_attractor_day = purrr::pmap(list(..1 = graph_from_adjacency,
..2 = connecting_to_strongest,
..3 = connecting_to_2nd_strongest),
.f = ~{
data.frame(strength = igraph::strength(..1),
time = 1:length(igraph::strength(..1))) %>%
dplyr::filter(!time %in% ..2,
!time %in% ..3) %>%
dplyr::arrange(desc(strength)) %>%
dplyr::slice(1) %>%
dplyr::pull(time)
}
))
# Extract nodes (i.e. times) which connect to the 3rd strongest node
emadata_nested_wrangled_both_recnets_nodes <- emadata_nested_wrangled_both_recnets_nodes %>%
dplyr::mutate(connecting_to_3rd_strongest = purrr::map2(.x = list_of_edges,
.y = tertiary_attractor_day,
.f = ~{
.x %>% dplyr::filter(from == .y | to == .y) %>%
dplyr::arrange(weight) %>%
tidyr::pivot_longer(cols = c(from, to),
values_to = "node") %>%
dplyr::distinct(node,
#.keep_all = TRUE
) %>%
dplyr::pull(node)
}
)
)
# Save as a variable
emadata_nested_wrangled_both_recnets_nodes <- emadata_nested_wrangled_both_recnets_nodes %>%
dplyr::mutate(all_nodes_with_strengths = purrr::map2(.x = all_nodes_with_strengths,
.y = connecting_to_3rd_strongest,
.f = ~{
dplyr::mutate(.x,
connecting_to_3rd_strongest =
dplyr::case_when(time %in% .y ~ TRUE,
TRUE ~ FALSE))
}
))
# Get number of 4th maximally connected node, which doesn't connect to the 1st, 2nd, or 3rd
emadata_nested_wrangled_both_recnets_nodes <- emadata_nested_wrangled_both_recnets_nodes %>%
dplyr::mutate(fourth_attractor_day = purrr::pmap(list(..1 = graph_from_adjacency,
..2 = connecting_to_strongest,
..3 = connecting_to_2nd_strongest,
..4 = connecting_to_3rd_strongest),
.f = ~{
data.frame(strength = igraph::strength(..1),
time = 1:length(igraph::strength(..1))) %>%
dplyr::filter(!time %in% ..2,
!time %in% ..3,
!time %in% ..4) %>%
dplyr::arrange(desc(strength)) %>%
dplyr::slice(1) %>%
dplyr::pull(time)
}
))
# Extract nodes (i.e. times) which connect to the 4th strongest node
emadata_nested_wrangled_both_recnets_nodes <- emadata_nested_wrangled_both_recnets_nodes %>%
dplyr::mutate(connecting_to_4th_strongest = purrr::map2(.x = list_of_edges,
.y = fourth_attractor_day,
.f = ~{
.x %>% dplyr::filter(from == .y | to == .y) %>%
dplyr::arrange(weight) %>%
tidyr::pivot_longer(cols = c(from, to),
values_to = "node") %>%
dplyr::distinct(node,
#.keep_all = TRUE
) %>%
dplyr::pull(node)
}
)
)
# Save as a variable
emadata_nested_wrangled_both_recnets_nodes <- emadata_nested_wrangled_both_recnets_nodes %>%
dplyr::mutate(all_nodes_with_strengths = purrr::map2(.x = all_nodes_with_strengths,
.y = connecting_to_4th_strongest,
.f = ~{
dplyr::mutate(.x,
connecting_to_4th_strongest =
dplyr::case_when(time %in% .y ~ TRUE,
TRUE ~ FALSE))
}
))
################### Make plots
emadata_nested_wrangled_both_recnets_nodes_plots <- emadata_nested_wrangled_both_recnets_nodes %>%
dplyr::mutate(all_nodes_with_strengths =
purrr::map(.x = all_nodes_with_strengths,
.f = ~{
dplyr::mutate(.x,
attractors = dplyr::case_when(
strength == 0 ~ "Unique",
connecting_to_strongest == TRUE ~ "1st",
connecting_to_2nd_strongest == TRUE ~ "2nd",
connecting_to_3rd_strongest == TRUE ~ "3rd",
connecting_to_4th_strongest == TRUE ~ "4th",
TRUE ~ "Uncategorised"),
attractors = factor(attractors,
levels = c("1st",
"2nd",
"3rd",
"4th",
"Uncategorised",
"Unique")),
name = factor(name,
levels = c("pleasure",
"interest",
"importance",
"situation_requires",
"anxiety_guilt_avoidance",
"another_wants"),
labels = c("Pleasure",
"Interest",
"Importance",
"Situation requires",
"Anxiety guilt avoidance",
"Another wants")) %>%
forcats::fct_drop()) %>%
dplyr::group_by(attractors, name) %>%
dplyr::mutate(n = n()) %>%
dplyr::ungroup() %>%
dplyr::mutate(maxtime = max(time),
percentage_of_total =
(n / maxtime) %>% scales::percent(accuracy = 0.1),
proportion_of_total = n/maxtime,
attractors_n =
factor(paste0(attractors,
" (n = ", n, "; ",
percentage_of_total, ")")))
}
))Spiral graph with colored nodes
emadata_nested_wrangled_both_recnets_nodes_plots <- emadata_nested_wrangled_both_recnets_nodes_plots %>%
  dplyr::mutate(node_colors = purrr::map(.x = all_nodes_with_strengths,
                                         .f = ~{tidyr::pivot_wider(.x, names_from = name) %>%
                                             dplyr::pull(attractors)}))

for (i in 1:nrow(emadata_nested_wrangled_both_recnets_nodes_plots)) {
levels(emadata_nested_wrangled_both_recnets_nodes_plots$node_colors[[i]]) <-
  c(viridisLite::plasma(4,
                      end = 0.8,
                      direction = -1), "gray48", "white")
  }

emadata_nested_wrangled_both_recnets_nodes_plots <- emadata_nested_wrangled_both_recnets_nodes_plots %>%
  dplyr::mutate(spiralgraph_epochs = purrr::pmap(list(..1 = graph_from_adjacency,
                                          ..2 = node_colors,
                                          ..3 = User),
                                     .f =  ~casnet::make_spiral_graph(g = ..1,
                                                                      arcs = 4,
                                                                      # a = .1,
                                                                      # b = 2,
                                                                      markTimeBy = TRUE,
                                                                      markEpochsBy = ..2,
                                                                      epochColours = ..2,
                                                                      showEpochLegend = FALSE,
                                                                      scaleEdgeSize = 1/10,
                                                                      scaleVertexSize = c(1, 5),
                                                                      showSizeLegend = FALSE,
                                                                      sizeLabel = "Node strength",
                                                                      type = "Euler",
                                                                      # alphaE = 0.1
                                                                      # title = ..3
                                     )))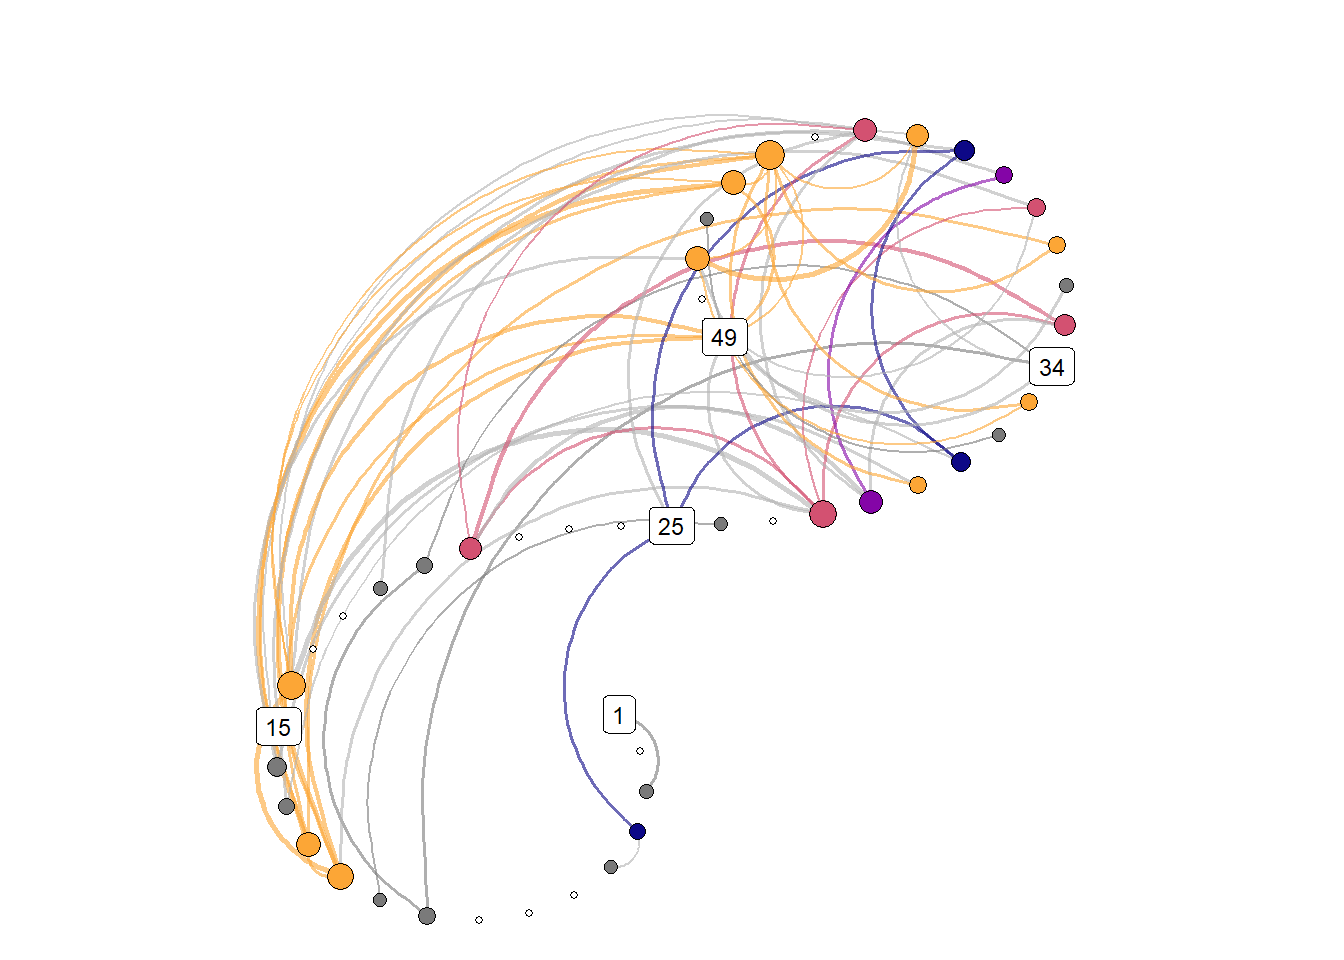
# emadata_nested_wrangled_both_recnets_nodes_plots$spiralgraph_epochs[[1]] +
#   theme(plot.margin=grid::unit(c(0,0,0,0), "mm"))

# ggsave(filename = "./figures/recnetwork.png",
#        width = 7,
#        height = 7)

# emadata_nested_wrangled_both_recnets_nodes_plots$all_nodes_with_strengths[[1]]
Attractor plot
emadata_nested_wrangled_both_recnets_nodes_plots <- emadata_nested_wrangled_both_recnets_nodes_plots %>%
  dplyr::mutate(observations = purrr::map_dbl(.x = sample2_standardised,
                                              .f = ~nrow(.)))

emadata_nested_wrangled_both_recnets_nodes_plots <- emadata_nested_wrangled_both_recnets_nodes_plots %>%
  dplyr::mutate(observations_daily = purrr::map_dbl(.x = data_daily,
                                              .f = ~nrow(.)))


emadata_nested_wrangled_both_recnets_nodes_plots <- emadata_nested_wrangled_both_recnets_nodes_plots %>%
  dplyr::mutate(
    attractor_plots =
      purrr::pmap(list(..1 = all_nodes_with_strengths,
                       ..2 = observations,
                       ..3 = observations_daily,
                       ..4 = User),
                  .f = ~{
                    dplyr::mutate(..1,
                                  strength_rescaled =
                                    scales::rescale(strength, to = c(0.3, 1.1)),
                                  alpha_strength = ifelse(strength_rescaled == 0.3,
                                                          0.5,
                                                          strength_rescaled)) %>%
                      ggplot(data = .,
                             aes(x = forcats::fct_rev(name),
                                 y = value,
                                 size = strength_rescaled,
                                 alpha = alpha_strength,
                                 color = attractors_n)) +
                      scale_size_identity() +
                      scale_alpha_identity() +
                      geom_point(aes(alpha = alpha_strength)) +
                      geom_line(aes(group = time,
                                    alpha = alpha_strength)) +
                      scale_color_manual(values = c(viridisLite::plasma(4,
                                                                        end = 0.8,
                                                                        direction = -1),
                                                    "gray40", "gray50")) +
                      scale_y_continuous(labels = scales::label_percent(accuracy = 1)) +
                      theme_bw() +
                      theme(legend.position = "none") +
                      labs(y = "Percentage of maximum reported value of variable, across full time series",
                           x = NULL,
                           title = paste0("Participant \"", ..4, "\" - based on ", ..2, " data points (", ..3, " days)")) +
                      facet_wrap(~attractors_n) +
                      coord_flip(ylim = c(0, 1))
                  }
      ))

emadata_nested_wrangled_both_recnets_nodes_plots$attractor_plots[[1]]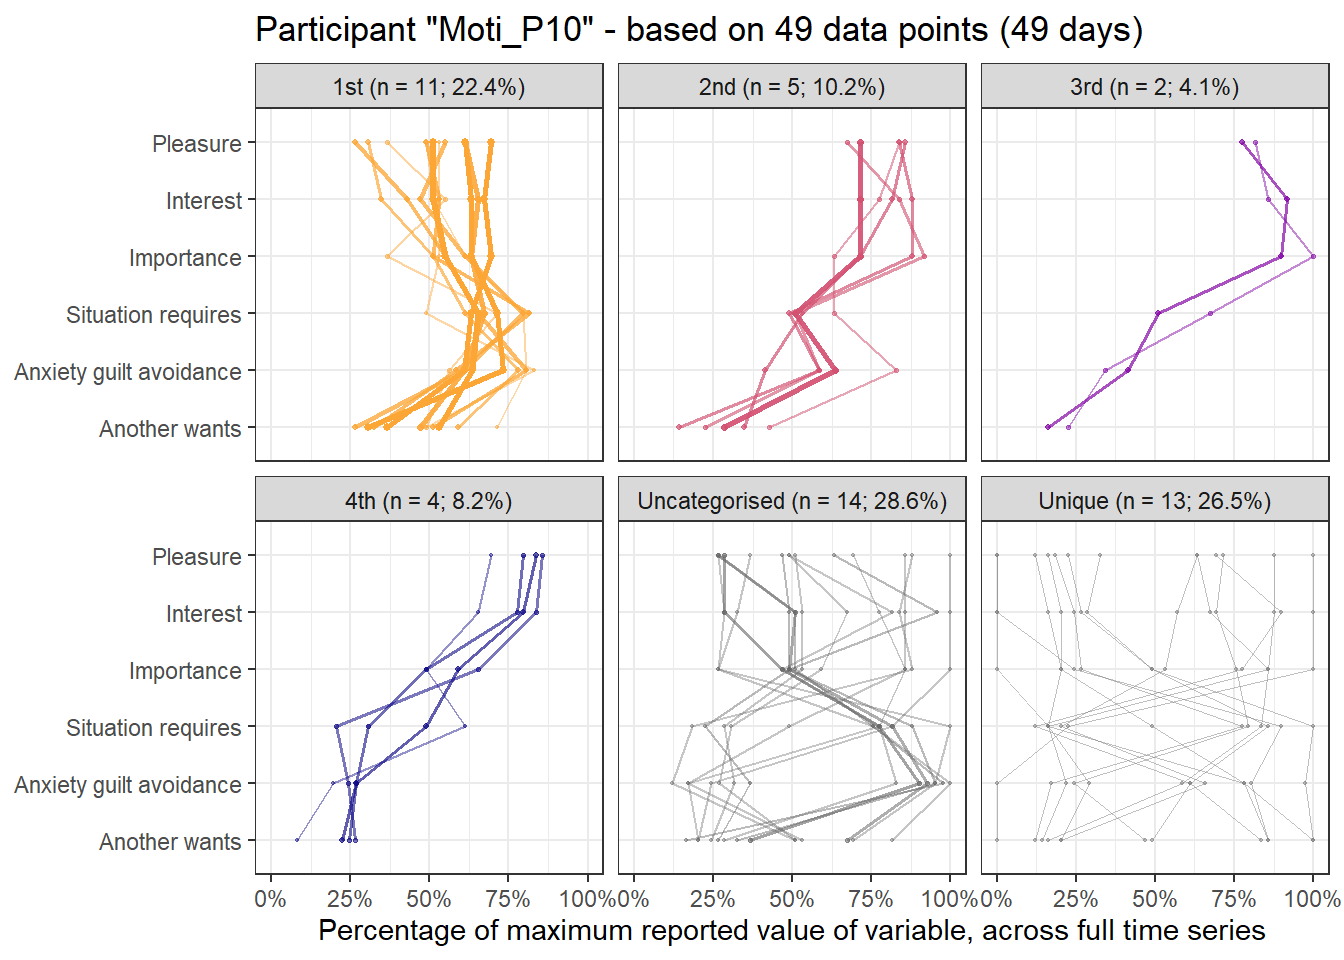
# emadata_nested_wrangled_both_recnets_nodes_plots$all_nodes_with_strengths[[1]]3. Single randomly sampled daily observation
Here’s the 6-dimensional motivation system’s recurrence plot, weighted by similarity.
set.seed(100)

#######################

# si = similarity under the radius
emadata_nested_wrangled_both_recnets <- emadata_nested_wrangled %>%
  dplyr::mutate(RN = purrr::map(.x = sample3_standardised,
                                .f =  ~casnet::rn(.x %>% dplyr::select(#autonomy, competence, relatedness,
                                                                       pleasure, interest, importance,
                                                                       situation_requires,
                                                                       anxiety_guilt_avoidance,
                                                                       another_wants),
                                                  doEmbed = FALSE,
                                                  weighted = TRUE,
                                                  weightedBy = "si",
                                                  emRad = NA)))
##
## Auto-recurrence: Setting diagonal to (1 + max. distance) for analyses
##
## Searching for a radius that will yield 0.05 for RR

emadata_nested_wrangled_both_recnets <- emadata_nested_wrangled_both_recnets %>%
  dplyr::mutate(graph_from_adjacency = purrr::map(.x = RN,
                                                  .f = ~igraph::graph_from_adjacency_matrix(.x,
                                                                                            weighted = TRUE,
                                                                                            mode = "upper",
                                                                                            diag = FALSE)))

# Edges with their distances
emadata_nested_wrangled_both_recnets <- emadata_nested_wrangled_both_recnets %>%
  dplyr::mutate(edges_with_distances = purrr::map(.x = graph_from_adjacency,
                                                  .f = ~igraph::E(.x)$weight),
                graph_from_adjacency_orig = graph_from_adjacency)

# Larger values are closer to the state; inverse of weight makes it more intuitive
for (i in 1:nrow(emadata_nested_wrangled_both_recnets)) {
igraph::E(emadata_nested_wrangled_both_recnets$graph_from_adjacency[[i]])$weight <- (1/emadata_nested_wrangled_both_recnets$edges_with_distances[[i]])
}
# A later note to self: Now weight is a measure of distance; how far apart two time points are
# (under the radius, i.e. they're reasonably similar to begin with)

####### To check:
# igraph::E(emadata_nested_wrangled_both_recnets$graph_from_adjacency[[1]])$weight
# igraph::E(emadata_nested_wrangled_both_recnets$graph_from_adjacency_orig[[1]])$weight

emadata_nested_wrangled_both_recnets <- emadata_nested_wrangled_both_recnets %>%
  dplyr::mutate(RN_plot = purrr::map(.x = RN,
                                .f =  ~casnet::rn_plot(.x,
                                                       plotDimensions = TRUE,
                                                       xlab = "6-dimensional motivation system",
                                                       ylab = "6-dimensional motivation system")))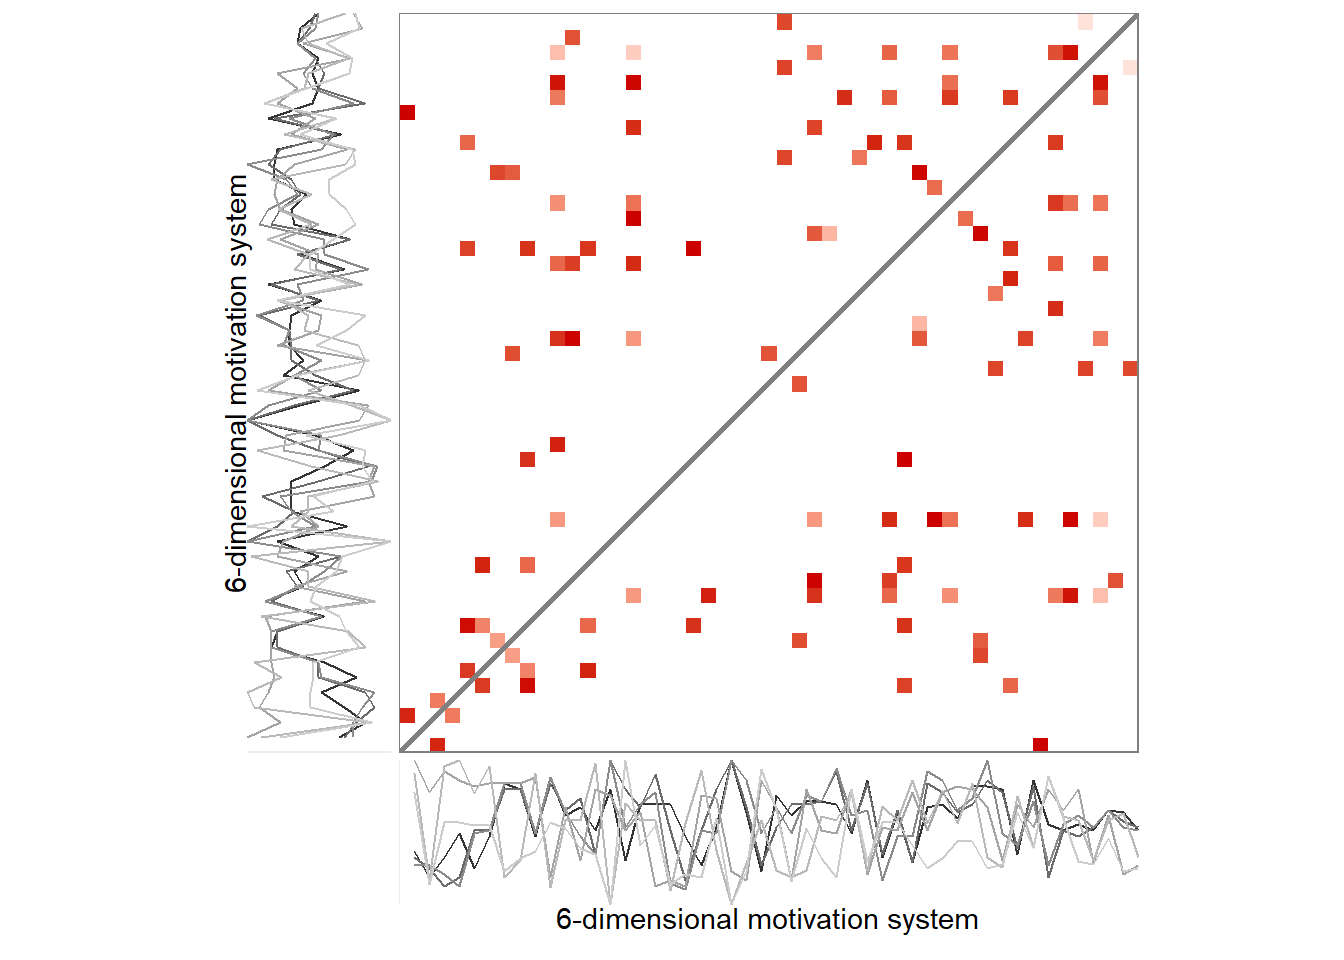
# Make node size equal to strength. Strength is the sum of a node's edge weights.
for (i in 1:nrow(emadata_nested_wrangled_both_recnets)) {
igraph::V(emadata_nested_wrangled_both_recnets$graph_from_adjacency[[i]])$size <- (igraph::strength(emadata_nested_wrangled_both_recnets$graph_from_adjacency[[i]]))
}

# Rescaling weight as "width"; varies between 5 and 10
for (i in 1:nrow(emadata_nested_wrangled_both_recnets)) {
igraph::E(emadata_nested_wrangled_both_recnets$graph_from_adjacency[[i]])$width <-
  casnet::elascer(igraph::E(emadata_nested_wrangled_both_recnets$graph_from_adjacency[[i]])$weight, lo = 5, hi = 10)
}
The lengthy code chunk below extracts and marks attractors in the data.
# Get number of maximally connected node
emadata_nested_wrangled_both_recnets_nodes <- emadata_nested_wrangled_both_recnets %>%
dplyr::mutate(strongest_day = purrr::map(.x = graph_from_adjacency,
.f = ~which.max(igraph::strength(.x))
))
emadata_nested_wrangled_both_recnets_nodes <- emadata_nested_wrangled_both_recnets_nodes %>%
dplyr::mutate(list_of_edges = purrr::map(.x = graph_from_adjacency,
.f = ~igraph::get.data.frame(.x)
))
emadata_nested_wrangled_both_recnets_nodes <- emadata_nested_wrangled_both_recnets_nodes %>%
dplyr::mutate(all_nodes_with_strengths =
purrr::map2(.x = sample3_standardised,
.y = graph_from_adjacency,
.f = ~{
data.frame(.x %>%
dplyr::select(#autonomy, competence, relatedness,
pleasure, interest, importance,
situation_requires, anxiety_guilt_avoidance, another_wants),
strength = igraph::strength(.y)) %>%
dplyr::mutate(time = dplyr::row_number()) %>%
tidyr::pivot_longer(cols = c(-strength, -time))
}
))
# Extract nodes (i.e. times) which connect to the strongest (i.e. most connected) node
emadata_nested_wrangled_both_recnets_nodes <- emadata_nested_wrangled_both_recnets_nodes %>%
dplyr::mutate(connecting_to_strongest = purrr::map2(.x = list_of_edges,
.y = strongest_day,
.f = ~{
.x %>% dplyr::filter(from == .y | to == .y) %>%
dplyr::arrange(weight) %>%
tidyr::pivot_longer(cols = c(from, to),
values_to = "node") %>%
dplyr::distinct(node,
#.keep_all = TRUE
) %>%
dplyr::pull(node)
}
)
)
emadata_nested_wrangled_both_recnets_nodes <- emadata_nested_wrangled_both_recnets_nodes %>%
dplyr::mutate(all_nodes_with_strengths = purrr::map2(.x = all_nodes_with_strengths,
.y = connecting_to_strongest,
.f = ~{
dplyr::mutate(.x,
connecting_to_strongest =
dplyr::case_when(time %in% .y ~ TRUE,
TRUE ~ FALSE))
}
))
# Get number of 2nd maximally connected node, which doesn't connect to the 1st
emadata_nested_wrangled_both_recnets_nodes <- emadata_nested_wrangled_both_recnets_nodes %>%
dplyr::mutate(secondary_attractor_day = purrr::map2(.x = graph_from_adjacency,
.y = connecting_to_strongest,
.f = ~{
data.frame(strength = igraph::strength(.x),
time = 1:length(igraph::strength(.x))) %>%
dplyr::filter(!time %in% .y) %>%
dplyr::arrange(desc(strength)) %>%
dplyr::slice(1) %>%
dplyr::pull(time)
}
))
# Extract nodes (i.e. times) which connect to the 2nd strongest node, which doesn't connect to the 1st
emadata_nested_wrangled_both_recnets_nodes <- emadata_nested_wrangled_both_recnets_nodes %>%
dplyr::mutate(connecting_to_2nd_strongest = purrr::map2(.x = list_of_edges,
.y = secondary_attractor_day,
.f = ~{
.x %>% dplyr::filter(from == .y | to == .y) %>%
dplyr::arrange(weight) %>%
tidyr::pivot_longer(cols = c(from, to),
values_to = "node") %>%
dplyr::distinct(node,
#.keep_all = TRUE
) %>%
dplyr::pull(node)
}
)
)
# Save as a variable in the dataset
emadata_nested_wrangled_both_recnets_nodes <- emadata_nested_wrangled_both_recnets_nodes %>%
dplyr::mutate(all_nodes_with_strengths = purrr::map2(.x = all_nodes_with_strengths,
.y = connecting_to_2nd_strongest,
.f = ~{
dplyr::mutate(.x,
connecting_to_2nd_strongest =
dplyr::case_when(time %in% .y ~ TRUE,
TRUE ~ FALSE))
}
))
# Get number of 3rd maximally connected node, which doesn't connect to the 1st or second
emadata_nested_wrangled_both_recnets_nodes <- emadata_nested_wrangled_both_recnets_nodes %>%
dplyr::mutate(tertiary_attractor_day = purrr::pmap(list(..1 = graph_from_adjacency,
..2 = connecting_to_strongest,
..3 = connecting_to_2nd_strongest),
.f = ~{
data.frame(strength = igraph::strength(..1),
time = 1:length(igraph::strength(..1))) %>%
dplyr::filter(!time %in% ..2,
!time %in% ..3) %>%
dplyr::arrange(desc(strength)) %>%
dplyr::slice(1) %>%
dplyr::pull(time)
}
))
# Extract nodes (i.e. times) which connect to the 3rd strongest node
emadata_nested_wrangled_both_recnets_nodes <- emadata_nested_wrangled_both_recnets_nodes %>%
dplyr::mutate(connecting_to_3rd_strongest = purrr::map2(.x = list_of_edges,
.y = tertiary_attractor_day,
.f = ~{
.x %>% dplyr::filter(from == .y | to == .y) %>%
dplyr::arrange(weight) %>%
tidyr::pivot_longer(cols = c(from, to),
values_to = "node") %>%
dplyr::distinct(node,
#.keep_all = TRUE
) %>%
dplyr::pull(node)
}
)
)
# Save as a variable
emadata_nested_wrangled_both_recnets_nodes <- emadata_nested_wrangled_both_recnets_nodes %>%
dplyr::mutate(all_nodes_with_strengths = purrr::map2(.x = all_nodes_with_strengths,
.y = connecting_to_3rd_strongest,
.f = ~{
dplyr::mutate(.x,
connecting_to_3rd_strongest =
dplyr::case_when(time %in% .y ~ TRUE,
TRUE ~ FALSE))
}
))
# Get number of 4th maximally connected node, which doesn't connect to the 1st, 2nd, or 3rd
emadata_nested_wrangled_both_recnets_nodes <- emadata_nested_wrangled_both_recnets_nodes %>%
dplyr::mutate(fourth_attractor_day = purrr::pmap(list(..1 = graph_from_adjacency,
..2 = connecting_to_strongest,
..3 = connecting_to_2nd_strongest,
..4 = connecting_to_3rd_strongest),
.f = ~{
data.frame(strength = igraph::strength(..1),
time = 1:length(igraph::strength(..1))) %>%
dplyr::filter(!time %in% ..2,
!time %in% ..3,
!time %in% ..4) %>%
dplyr::arrange(desc(strength)) %>%
dplyr::slice(1) %>%
dplyr::pull(time)
}
))
# Extract nodes (i.e. times) which connect to the 4th strongest node
emadata_nested_wrangled_both_recnets_nodes <- emadata_nested_wrangled_both_recnets_nodes %>%
dplyr::mutate(connecting_to_4th_strongest = purrr::map2(.x = list_of_edges,
.y = fourth_attractor_day,
.f = ~{
.x %>% dplyr::filter(from == .y | to == .y) %>%
dplyr::arrange(weight) %>%
tidyr::pivot_longer(cols = c(from, to),
values_to = "node") %>%
dplyr::distinct(node,
#.keep_all = TRUE
) %>%
dplyr::pull(node)
}
)
)
# Save as a variable
emadata_nested_wrangled_both_recnets_nodes <- emadata_nested_wrangled_both_recnets_nodes %>%
dplyr::mutate(all_nodes_with_strengths = purrr::map2(.x = all_nodes_with_strengths,
.y = connecting_to_4th_strongest,
.f = ~{
dplyr::mutate(.x,
connecting_to_4th_strongest =
dplyr::case_when(time %in% .y ~ TRUE,
TRUE ~ FALSE))
}
))
################### Make plots
emadata_nested_wrangled_both_recnets_nodes_plots <- emadata_nested_wrangled_both_recnets_nodes %>%
dplyr::mutate(all_nodes_with_strengths =
purrr::map(.x = all_nodes_with_strengths,
.f = ~{
dplyr::mutate(.x,
attractors = dplyr::case_when(
strength == 0 ~ "Unique",
connecting_to_strongest == TRUE ~ "1st",
connecting_to_2nd_strongest == TRUE ~ "2nd",
connecting_to_3rd_strongest == TRUE ~ "3rd",
connecting_to_4th_strongest == TRUE ~ "4th",
TRUE ~ "Uncategorised"),
attractors = factor(attractors,
levels = c("1st",
"2nd",
"3rd",
"4th",
"Uncategorised",
"Unique")),
name = factor(name,
levels = c("pleasure",
"interest",
"importance",
"situation_requires",
"anxiety_guilt_avoidance",
"another_wants"),
labels = c("Pleasure",
"Interest",
"Importance",
"Situation requires",
"Anxiety guilt avoidance",
"Another wants")) %>%
forcats::fct_drop()) %>%
dplyr::group_by(attractors, name) %>%
dplyr::mutate(n = n()) %>%
dplyr::ungroup() %>%
dplyr::mutate(maxtime = max(time),
percentage_of_total =
(n / maxtime) %>% scales::percent(accuracy = 0.1),
proportion_of_total = n/maxtime,
attractors_n =
factor(paste0(attractors,
" (n = ", n, "; ",
percentage_of_total, ")")))
}
))Spiral graph with colored nodes
emadata_nested_wrangled_both_recnets_nodes_plots <- emadata_nested_wrangled_both_recnets_nodes_plots %>%
  dplyr::mutate(node_colors = purrr::map(.x = all_nodes_with_strengths,
                                         .f = ~{tidyr::pivot_wider(.x, names_from = name) %>%
                                             dplyr::pull(attractors)}))

for (i in 1:nrow(emadata_nested_wrangled_both_recnets_nodes_plots)) {
levels(emadata_nested_wrangled_both_recnets_nodes_plots$node_colors[[i]]) <-
  c(viridisLite::plasma(4,
                      end = 0.8,
                      direction = -1), "gray48", "white")
  }

emadata_nested_wrangled_both_recnets_nodes_plots <- emadata_nested_wrangled_both_recnets_nodes_plots %>%
  dplyr::mutate(spiralgraph_epochs = purrr::pmap(list(..1 = graph_from_adjacency,
                                          ..2 = node_colors,
                                          ..3 = User),
                                     .f =  ~casnet::make_spiral_graph(g = ..1,
                                                                      arcs = 4,
                                                                      # a = .1,
                                                                      # b = 2,
                                                                      markTimeBy = TRUE,
                                                                      markEpochsBy = ..2,
                                                                      epochColours = ..2,
                                                                      showEpochLegend = FALSE,
                                                                      scaleEdgeSize = 1/10,
                                                                      scaleVertexSize = c(1, 5),
                                                                      showSizeLegend = FALSE,
                                                                      sizeLabel = "Node strength",
                                                                      type = "Euler",
                                                                      # alphaE = 0.1
                                                                      # title = ..3
                                     )))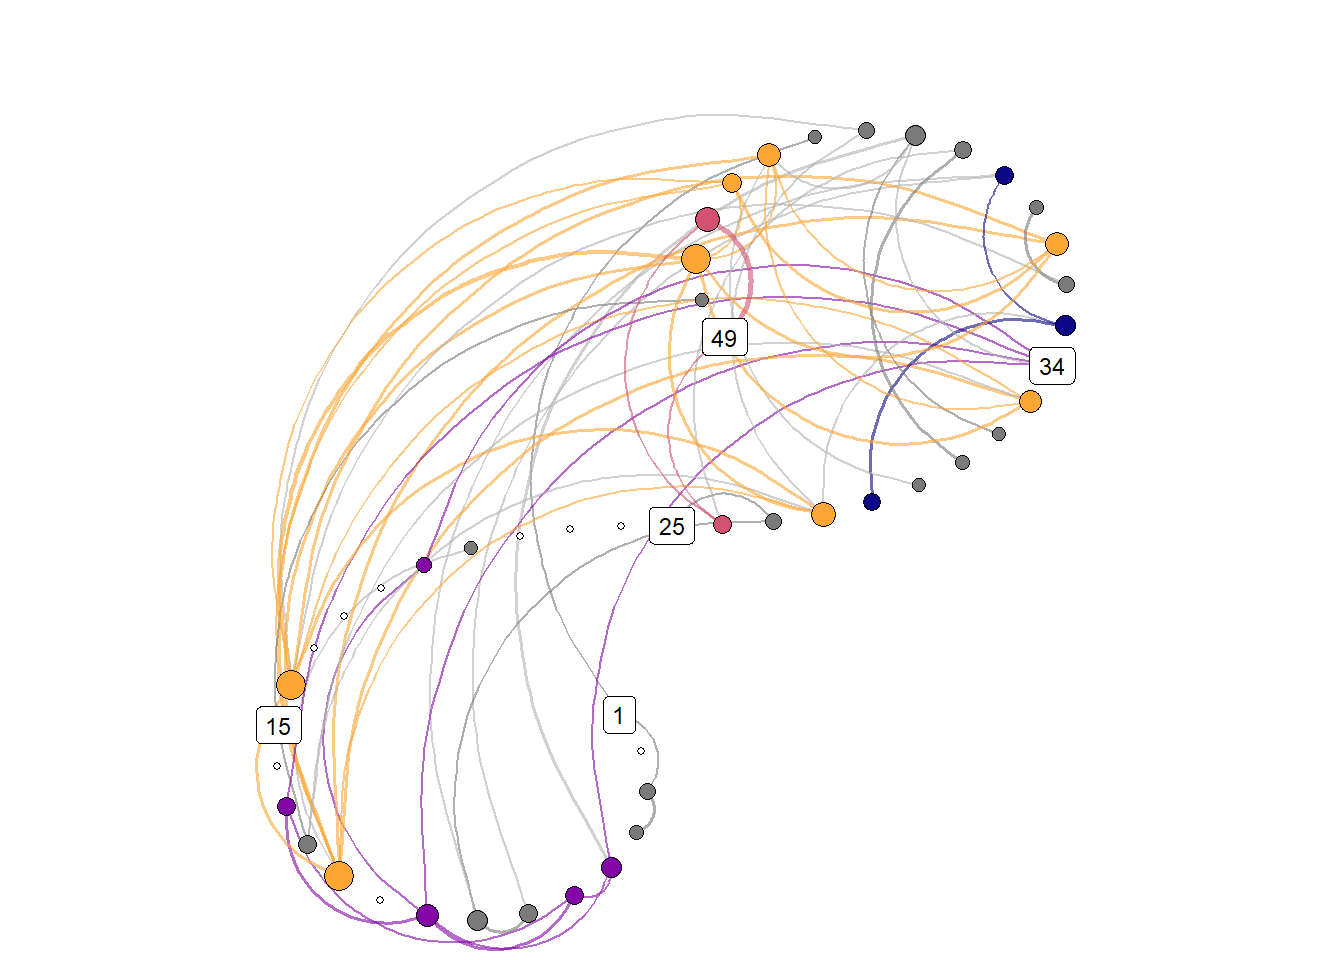
# emadata_nested_wrangled_both_recnets_nodes_plots$spiralgraph_epochs[[1]] +
#   theme(plot.margin=grid::unit(c(0,0,0,0), "mm"))

# ggsave(filename = "./figures/recnetwork.png",
#        width = 7,
#        height = 7)

# emadata_nested_wrangled_both_recnets_nodes_plots$all_nodes_with_strengths[[1]]
Attractor plot
emadata_nested_wrangled_both_recnets_nodes_plots <- emadata_nested_wrangled_both_recnets_nodes_plots %>%
  dplyr::mutate(observations = purrr::map_dbl(.x = sample3_standardised,
                                              .f = ~nrow(.)))

emadata_nested_wrangled_both_recnets_nodes_plots <- emadata_nested_wrangled_both_recnets_nodes_plots %>%
  dplyr::mutate(observations_daily = purrr::map_dbl(.x = data_daily,
                                              .f = ~nrow(.)))


emadata_nested_wrangled_both_recnets_nodes_plots <- emadata_nested_wrangled_both_recnets_nodes_plots %>%
  dplyr::mutate(
    attractor_plots =
      purrr::pmap(list(..1 = all_nodes_with_strengths,
                       ..2 = observations,
                       ..3 = observations_daily,
                       ..4 = User),
                  .f = ~{
                    dplyr::mutate(..1,
                                  strength_rescaled =
                                    scales::rescale(strength, to = c(0.3, 1.1)),
                                  alpha_strength = ifelse(strength_rescaled == 0.3,
                                                          0.5,
                                                          strength_rescaled)) %>%
                      ggplot(data = .,
                             aes(x = forcats::fct_rev(name),
                                 y = value,
                                 size = strength_rescaled,
                                 alpha = alpha_strength,
                                 color = attractors_n)) +
                      scale_size_identity() +
                      scale_alpha_identity() +
                      geom_point(aes(alpha = alpha_strength)) +
                      geom_line(aes(group = time,
                                    alpha = alpha_strength)) +
                      scale_color_manual(values = c(viridisLite::plasma(4,
                                                                        end = 0.8,
                                                                        direction = -1),
                                                    "gray40", "gray50")) +
                      scale_y_continuous(labels = scales::label_percent(accuracy = 1)) +
                      theme_bw() +
                      theme(legend.position = "none") +
                      labs(y = "Percentage of maximum reported value of variable, across full time series",
                           x = NULL,
                           title = paste0("Participant \"", ..4, "\" - based on ", ..2, " data points (", ..3, " days)")) +
                      facet_wrap(~attractors_n) +
                      coord_flip(ylim = c(0, 1))
                  }
      ))

emadata_nested_wrangled_both_recnets_nodes_plots$attractor_plots[[1]]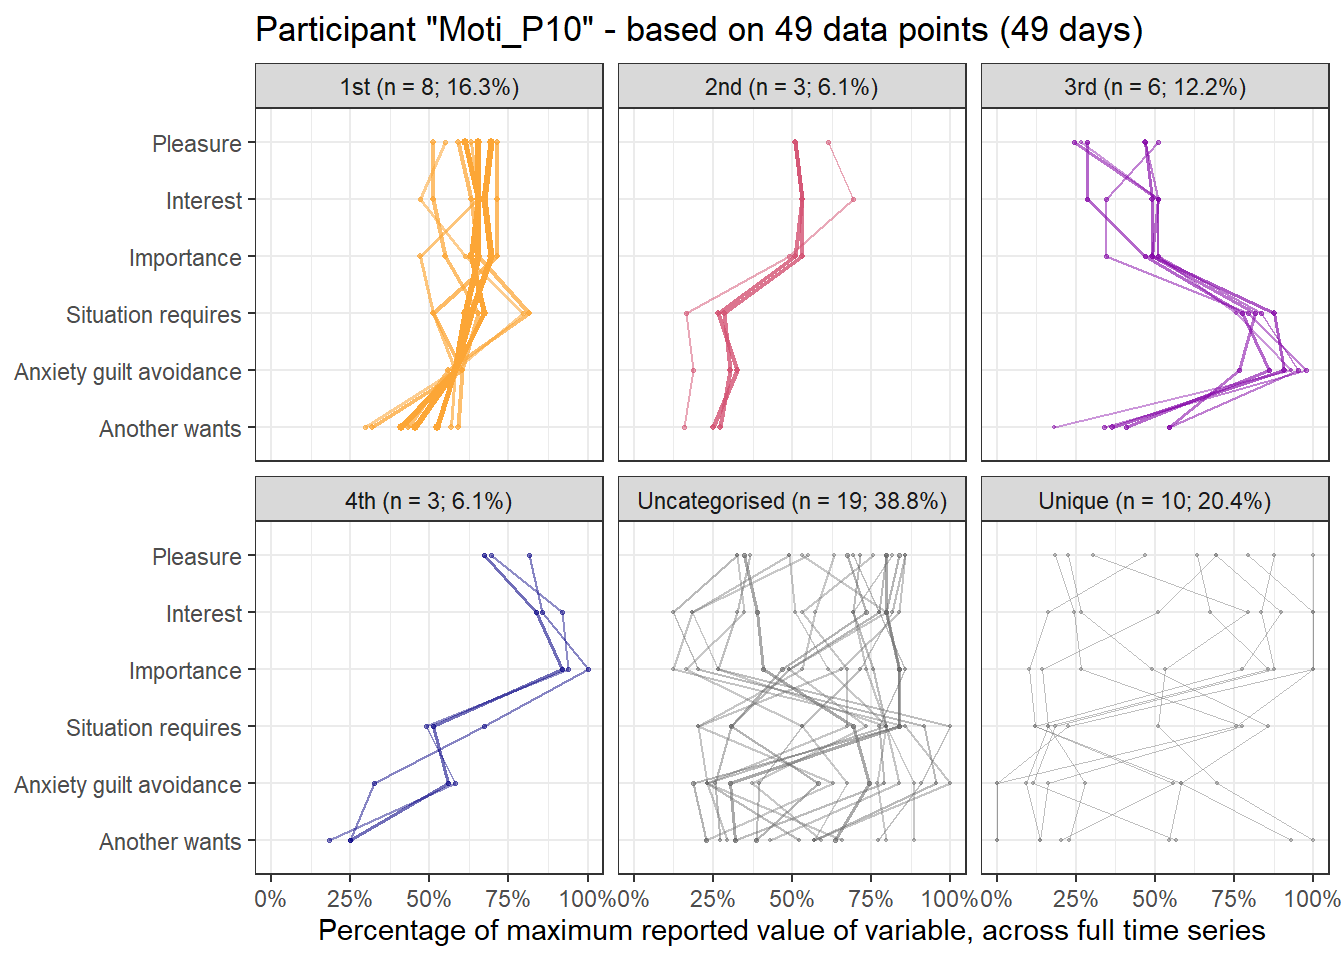
# emadata_nested_wrangled_both_recnets_nodes_plots$all_nodes_with_strengths[[1]]All data
Here’s the 6-dimensional motivation system’s recurrence plot, weighted by similarity.
set.seed(1)

#######################

# si = similarity under the radius
emadata_nested_wrangled_both_recnets <- emadata_nested_wrangled %>%
  dplyr::mutate(RN = purrr::map(.x = data_standardised,
                                .f =  ~casnet::rn(.x %>% dplyr::select(#autonomy, competence, relatedness,
                                                                       pleasure, interest, importance,
                                                                       situation_requires,
                                                                       anxiety_guilt_avoidance,
                                                                       another_wants),
                                                  doEmbed = FALSE,
                                                  weighted = TRUE,
                                                  weightedBy = "si",
                                                  emRad = NA)))
##
## Auto-recurrence: Setting diagonal to (1 + max. distance) for analyses
##
## Searching for a radius that will yield 0.05 for RR

emadata_nested_wrangled_both_recnets <- emadata_nested_wrangled_both_recnets %>%
  dplyr::mutate(graph_from_adjacency = purrr::map(.x = RN,
                                                  .f = ~igraph::graph_from_adjacency_matrix(.x,
                                                                                            weighted = TRUE,
                                                                                            mode = "upper",
                                                                                            diag = FALSE)))

# Edges with their distances
emadata_nested_wrangled_both_recnets <- emadata_nested_wrangled_both_recnets %>%
  dplyr::mutate(edges_with_distances = purrr::map(.x = graph_from_adjacency,
                                                  .f = ~igraph::E(.x)$weight),
                graph_from_adjacency_orig = graph_from_adjacency)

# Larger values are closer to the state; inverse of weight makes it more intuitive
for (i in 1:nrow(emadata_nested_wrangled_both_recnets)) {
igraph::E(emadata_nested_wrangled_both_recnets$graph_from_adjacency[[i]])$weight <- (1/emadata_nested_wrangled_both_recnets$edges_with_distances[[i]])
}
# A later note to self: Now weight is a measure of distance; how far apart two time points are
# (under the radius, i.e. they're reasonably similar to begin with)

####### To check:
# igraph::E(emadata_nested_wrangled_both_recnets$graph_from_adjacency[[1]])$weight
# igraph::E(emadata_nested_wrangled_both_recnets$graph_from_adjacency_orig[[1]])$weight

emadata_nested_wrangled_both_recnets <- emadata_nested_wrangled_both_recnets %>%
  dplyr::mutate(RN_plot = purrr::map(.x = RN,
                                .f =  ~casnet::rn_plot(.x,
                                                       plotDimensions = TRUE,
                                                       xlab = "6-dimensional motivation system",
                                                       ylab = "6-dimensional motivation system")))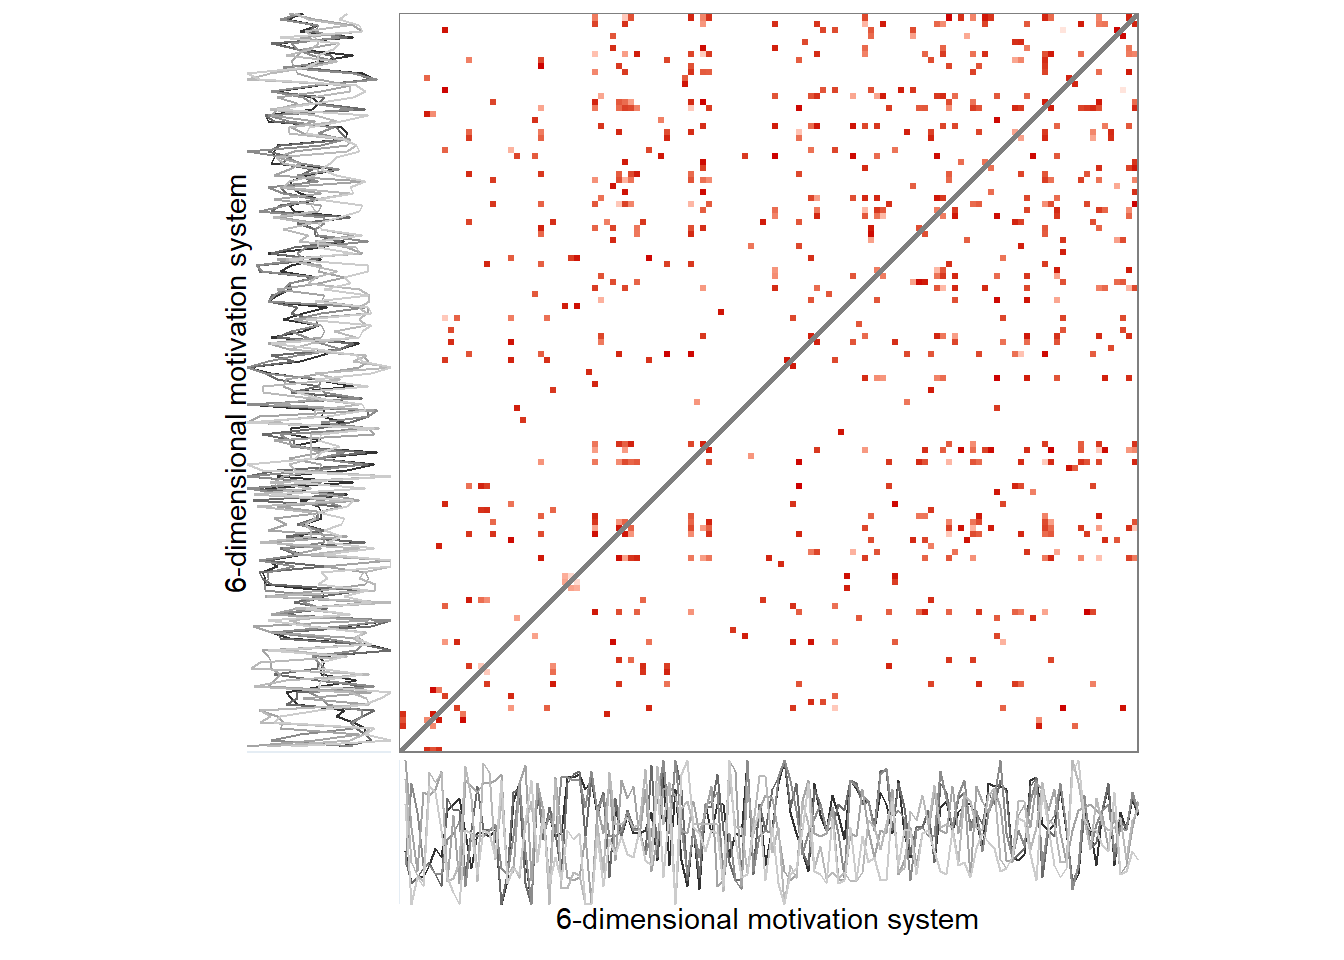
# Make node size equal to strength. Strength is the sum of a node's edge weights.
for (i in 1:nrow(emadata_nested_wrangled_both_recnets)) {
igraph::V(emadata_nested_wrangled_both_recnets$graph_from_adjacency[[i]])$size <- (igraph::strength(emadata_nested_wrangled_both_recnets$graph_from_adjacency[[i]]))
}

# Rescaling weight as "width"; varies between 5 and 10
for (i in 1:nrow(emadata_nested_wrangled_both_recnets)) {
igraph::E(emadata_nested_wrangled_both_recnets$graph_from_adjacency[[i]])$width <-
  casnet::elascer(igraph::E(emadata_nested_wrangled_both_recnets$graph_from_adjacency[[i]])$weight, lo = 5, hi = 10)
}
The lengthy code chunk below extracts and marks attractors in the data.
# Get number of maximally connected node
emadata_nested_wrangled_both_recnets_nodes <- emadata_nested_wrangled_both_recnets %>%
dplyr::mutate(strongest_day = purrr::map(.x = graph_from_adjacency,
.f = ~which.max(igraph::strength(.x))
))
emadata_nested_wrangled_both_recnets_nodes <- emadata_nested_wrangled_both_recnets_nodes %>%
dplyr::mutate(list_of_edges = purrr::map(.x = graph_from_adjacency,
.f = ~igraph::get.data.frame(.x)
))
emadata_nested_wrangled_both_recnets_nodes <- emadata_nested_wrangled_both_recnets_nodes %>%
dplyr::mutate(all_nodes_with_strengths =
purrr::map2(.x = data_standardised,
.y = graph_from_adjacency,
.f = ~{
data.frame(.x %>%
dplyr::select(#autonomy, competence, relatedness,
pleasure, interest, importance,
situation_requires, anxiety_guilt_avoidance, another_wants),
strength = igraph::strength(.y)) %>%
dplyr::mutate(time = dplyr::row_number()) %>%
tidyr::pivot_longer(cols = c(-strength, -time))
}
))
# Extract nodes (i.e. times) which connect to the strongest (i.e. most connected) node
emadata_nested_wrangled_both_recnets_nodes <- emadata_nested_wrangled_both_recnets_nodes %>%
dplyr::mutate(connecting_to_strongest = purrr::map2(.x = list_of_edges,
.y = strongest_day,
.f = ~{
.x %>% dplyr::filter(from == .y | to == .y) %>%
dplyr::arrange(weight) %>%
tidyr::pivot_longer(cols = c(from, to),
values_to = "node") %>%
dplyr::distinct(node,
#.keep_all = TRUE
) %>%
dplyr::pull(node)
}
)
)
emadata_nested_wrangled_both_recnets_nodes <- emadata_nested_wrangled_both_recnets_nodes %>%
dplyr::mutate(all_nodes_with_strengths = purrr::map2(.x = all_nodes_with_strengths,
.y = connecting_to_strongest,
.f = ~{
dplyr::mutate(.x,
connecting_to_strongest =
dplyr::case_when(time %in% .y ~ TRUE,
TRUE ~ FALSE))
}
))
# Get number of 2nd maximally connected node, which doesn't connect to the 1st
emadata_nested_wrangled_both_recnets_nodes <- emadata_nested_wrangled_both_recnets_nodes %>%
dplyr::mutate(secondary_attractor_day = purrr::map2(.x = graph_from_adjacency,
.y = connecting_to_strongest,
.f = ~{
data.frame(strength = igraph::strength(.x),
time = 1:length(igraph::strength(.x))) %>%
dplyr::filter(!time %in% .y) %>%
dplyr::arrange(desc(strength)) %>%
dplyr::slice(1) %>%
dplyr::pull(time)
}
))
# Extract nodes (i.e. times) which connect to the 2nd strongest node, which doesn't connect to the 1st
emadata_nested_wrangled_both_recnets_nodes <- emadata_nested_wrangled_both_recnets_nodes %>%
dplyr::mutate(connecting_to_2nd_strongest = purrr::map2(.x = list_of_edges,
.y = secondary_attractor_day,
.f = ~{
.x %>% dplyr::filter(from == .y | to == .y) %>%
dplyr::arrange(weight) %>%
tidyr::pivot_longer(cols = c(from, to),
values_to = "node") %>%
dplyr::distinct(node,
#.keep_all = TRUE
) %>%
dplyr::pull(node)
}
)
)
# Save as a variable in the dataset
emadata_nested_wrangled_both_recnets_nodes <- emadata_nested_wrangled_both_recnets_nodes %>%
dplyr::mutate(all_nodes_with_strengths = purrr::map2(.x = all_nodes_with_strengths,
.y = connecting_to_2nd_strongest,
.f = ~{
dplyr::mutate(.x,
connecting_to_2nd_strongest =
dplyr::case_when(time %in% .y ~ TRUE,
TRUE ~ FALSE))
}
))
# Get number of 3rd maximally connected node, which doesn't connect to the 1st or second
emadata_nested_wrangled_both_recnets_nodes <- emadata_nested_wrangled_both_recnets_nodes %>%
dplyr::mutate(tertiary_attractor_day = purrr::pmap(list(..1 = graph_from_adjacency,
..2 = connecting_to_strongest,
..3 = connecting_to_2nd_strongest),
.f = ~{
data.frame(strength = igraph::strength(..1),
time = 1:length(igraph::strength(..1))) %>%
dplyr::filter(!time %in% ..2,
!time %in% ..3) %>%
dplyr::arrange(desc(strength)) %>%
dplyr::slice(1) %>%
dplyr::pull(time)
}
))
# Extract nodes (i.e. times) which connect to the 3rd strongest node
emadata_nested_wrangled_both_recnets_nodes <- emadata_nested_wrangled_both_recnets_nodes %>%
dplyr::mutate(connecting_to_3rd_strongest = purrr::map2(.x = list_of_edges,
.y = tertiary_attractor_day,
.f = ~{
.x %>% dplyr::filter(from == .y | to == .y) %>%
dplyr::arrange(weight) %>%
tidyr::pivot_longer(cols = c(from, to),
values_to = "node") %>%
dplyr::distinct(node,
#.keep_all = TRUE
) %>%
dplyr::pull(node)
}
)
)
# Save as a variable
emadata_nested_wrangled_both_recnets_nodes <- emadata_nested_wrangled_both_recnets_nodes %>%
dplyr::mutate(all_nodes_with_strengths = purrr::map2(.x = all_nodes_with_strengths,
.y = connecting_to_3rd_strongest,
.f = ~{
dplyr::mutate(.x,
connecting_to_3rd_strongest =
dplyr::case_when(time %in% .y ~ TRUE,
TRUE ~ FALSE))
}
))
# Get number of 4th maximally connected node, which doesn't connect to the 1st, 2nd, or 3rd
emadata_nested_wrangled_both_recnets_nodes <- emadata_nested_wrangled_both_recnets_nodes %>%
dplyr::mutate(fourth_attractor_day = purrr::pmap(list(..1 = graph_from_adjacency,
..2 = connecting_to_strongest,
..3 = connecting_to_2nd_strongest,
..4 = connecting_to_3rd_strongest),
.f = ~{
data.frame(strength = igraph::strength(..1),
time = 1:length(igraph::strength(..1))) %>%
dplyr::filter(!time %in% ..2,
!time %in% ..3,
!time %in% ..4) %>%
dplyr::arrange(desc(strength)) %>%
dplyr::slice(1) %>%
dplyr::pull(time)
}
))
# Extract nodes (i.e. times) which connect to the 4th strongest node
emadata_nested_wrangled_both_recnets_nodes <- emadata_nested_wrangled_both_recnets_nodes %>%
dplyr::mutate(connecting_to_4th_strongest = purrr::map2(.x = list_of_edges,
.y = fourth_attractor_day,
.f = ~{
.x %>% dplyr::filter(from == .y | to == .y) %>%
dplyr::arrange(weight) %>%
tidyr::pivot_longer(cols = c(from, to),
values_to = "node") %>%
dplyr::distinct(node,
#.keep_all = TRUE
) %>%
dplyr::pull(node)
}
)
)
# Save as a variable
emadata_nested_wrangled_both_recnets_nodes <- emadata_nested_wrangled_both_recnets_nodes %>%
dplyr::mutate(all_nodes_with_strengths = purrr::map2(.x = all_nodes_with_strengths,
.y = connecting_to_4th_strongest,
.f = ~{
dplyr::mutate(.x,
connecting_to_4th_strongest =
dplyr::case_when(time %in% .y ~ TRUE,
TRUE ~ FALSE))
}
))
################### Make plots
emadata_nested_wrangled_both_recnets_nodes_plots <- emadata_nested_wrangled_both_recnets_nodes %>%
dplyr::mutate(all_nodes_with_strengths =
purrr::map(.x = all_nodes_with_strengths,
.f = ~{
dplyr::mutate(.x,
attractors = dplyr::case_when(
strength == 0 ~ "Unique",
connecting_to_strongest == TRUE ~ "1st",
connecting_to_2nd_strongest == TRUE ~ "2nd",
connecting_to_3rd_strongest == TRUE ~ "3rd",
connecting_to_4th_strongest == TRUE ~ "4th",
TRUE ~ "Uncategorised"),
attractors = factor(attractors,
levels = c("1st",
"2nd",
"3rd",
"4th",
"Uncategorised",
"Unique")),
name = factor(name,
levels = c("pleasure",
"interest",
"importance",
"situation_requires",
"anxiety_guilt_avoidance",
"another_wants"),
labels = c("Pleasure",
"Interest",
"Importance",
"Situation requires",
"Anxiety guilt avoidance",
"Another wants")) %>%
forcats::fct_drop()) %>%
dplyr::group_by(attractors, name) %>%
dplyr::mutate(n = n()) %>%
dplyr::ungroup() %>%
dplyr::mutate(maxtime = max(time),
percentage_of_total =
(n / maxtime) %>% scales::percent(accuracy = 0.1),
proportion_of_total = n/maxtime,
attractors_n =
factor(paste0(attractors,
" (n = ", n, "; ",
percentage_of_total, ")")))
}
))Spiral graph with colored nodes
emadata_nested_wrangled_both_recnets_nodes_plots <- emadata_nested_wrangled_both_recnets_nodes_plots %>%
  dplyr::mutate(node_colors = purrr::map(.x = all_nodes_with_strengths,
                                         .f = ~{tidyr::pivot_wider(.x, names_from = name) %>%
                                             dplyr::pull(attractors)}))

for (i in 1:nrow(emadata_nested_wrangled_both_recnets_nodes_plots)) {
levels(emadata_nested_wrangled_both_recnets_nodes_plots$node_colors[[i]]) <-
  c(viridisLite::plasma(4,
                      end = 0.8,
                      direction = -1), "gray48", "white")
  }

emadata_nested_wrangled_both_recnets_nodes_plots <- emadata_nested_wrangled_both_recnets_nodes_plots %>%
  dplyr::mutate(spiralgraph_epochs = purrr::pmap(list(..1 = graph_from_adjacency,
                                          ..2 = node_colors,
                                          ..3 = User),
                                     .f =  ~casnet::make_spiral_graph(g = ..1,
                                                                      arcs = 4,
                                                                      # a = .1,
                                                                      # b = 2,
                                                                      markTimeBy = TRUE,
                                                                      markEpochsBy = ..2,
                                                                      epochColours = ..2,
                                                                      showEpochLegend = FALSE,
                                                                      scaleEdgeSize = 1/10,
                                                                      scaleVertexSize = c(1, 5),
                                                                      showSizeLegend = FALSE,
                                                                      sizeLabel = "Node strength",
                                                                      type = "Euler",
                                                                      # alphaE = 0.1
                                                                      # title = ..3
                                     )))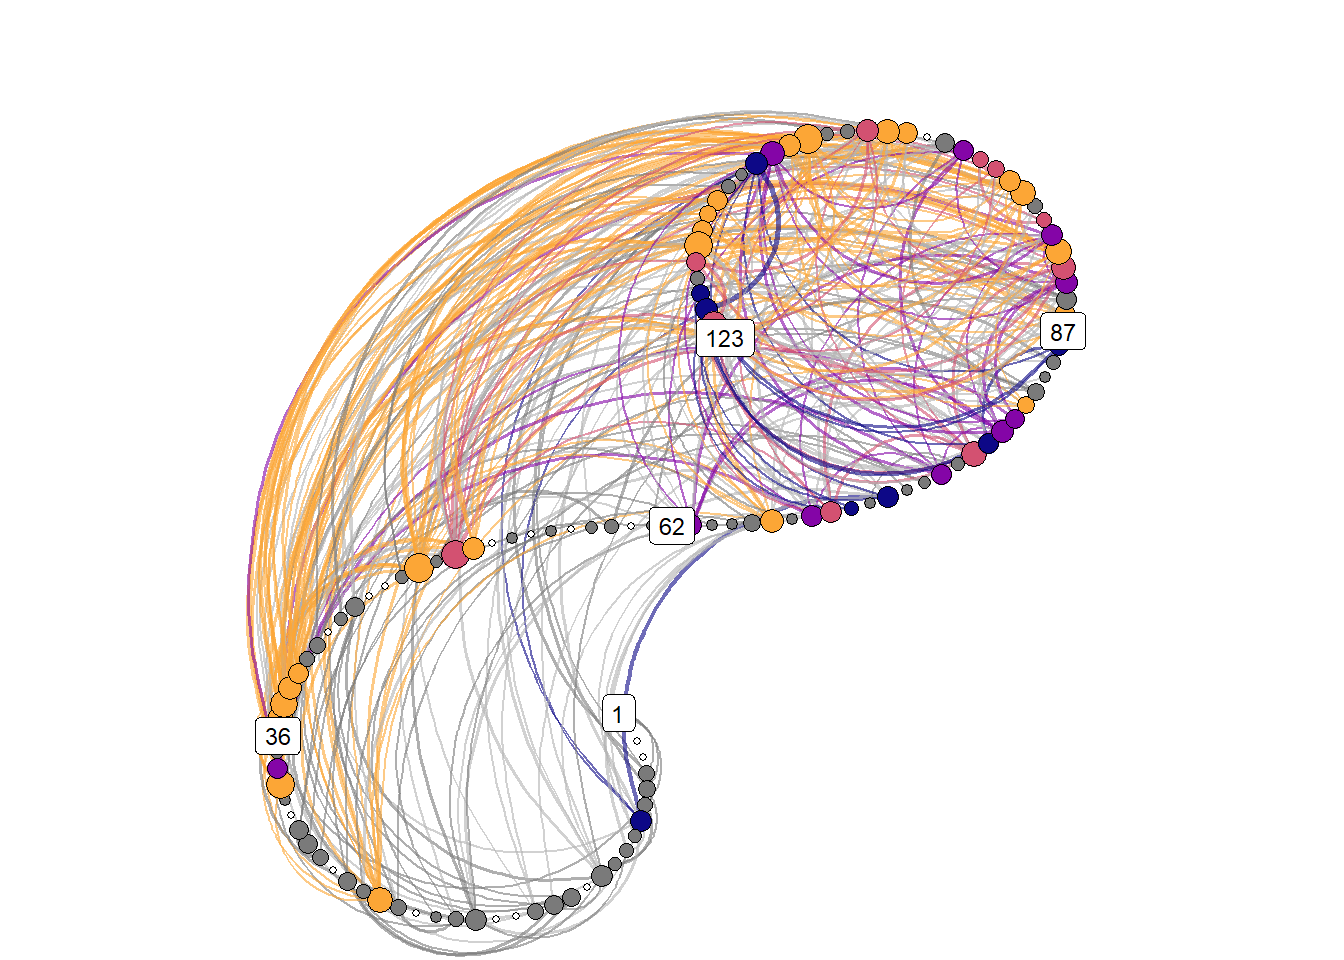
# emadata_nested_wrangled_both_recnets_nodes_plots$spiralgraph_epochs[[1]] +
#   theme(plot.margin=grid::unit(c(0,0,0,0), "mm"))

# ggsave(filename = "./figures/recnetwork.png",
#        width = 7,
#        height = 7)

# emadata_nested_wrangled_both_recnets_nodes_plots$all_nodes_with_strengths[[1]]
Attractor plot
emadata_nested_wrangled_both_recnets_nodes_plots <- emadata_nested_wrangled_both_recnets_nodes_plots %>%
  dplyr::mutate(observations = purrr::map_dbl(.x = data_standardised,
                                              .f = ~nrow(.)))

emadata_nested_wrangled_both_recnets_nodes_plots <- emadata_nested_wrangled_both_recnets_nodes_plots %>%
  dplyr::mutate(observations_daily = purrr::map_dbl(.x = data_daily,
                                              .f = ~nrow(.)))


emadata_nested_wrangled_both_recnets_nodes_plots <- emadata_nested_wrangled_both_recnets_nodes_plots %>%
  dplyr::mutate(
    attractor_plots =
      purrr::pmap(list(..1 = all_nodes_with_strengths,
                       ..2 = observations,
                       ..3 = observations_daily,
                       ..4 = User),
                  .f = ~{
                    dplyr::mutate(..1,
                                  strength_rescaled =
                                    scales::rescale(strength, to = c(0.3, 1.1)),
                                  alpha_strength = ifelse(strength_rescaled == 0.3,
                                                          0.5,
                                                          strength_rescaled)) %>%
                      ggplot(data = .,
                             aes(x = forcats::fct_rev(name),
                                 y = value,
                                 size = strength_rescaled,
                                 alpha = alpha_strength,
                                 color = attractors_n)) +
                      scale_size_identity() +
                      scale_alpha_identity() +
                      geom_point(aes(alpha = alpha_strength)) +
                      geom_line(aes(group = time,
                                    alpha = alpha_strength)) +
                      scale_color_manual(values = c(viridisLite::plasma(4,
                                                                        end = 0.8,
                                                                        direction = -1),
                                                    "gray40", "gray50")) +
                      scale_y_continuous(labels = scales::label_percent(accuracy = 1)) +
                      theme_bw() +
                      theme(legend.position = "none") +
                      labs(y = "Percentage of maximum reported value of variable, across full time series",
                           x = NULL,
                           title = paste0("Participant \"", ..4, "\" - based on ", ..2, " data points (", ..3, " days)")) +
                      facet_wrap(~attractors_n) +
                      coord_flip(ylim = c(0, 1))
                  }
      ))

emadata_nested_wrangled_both_recnets_nodes_plots$attractor_plots[[1]]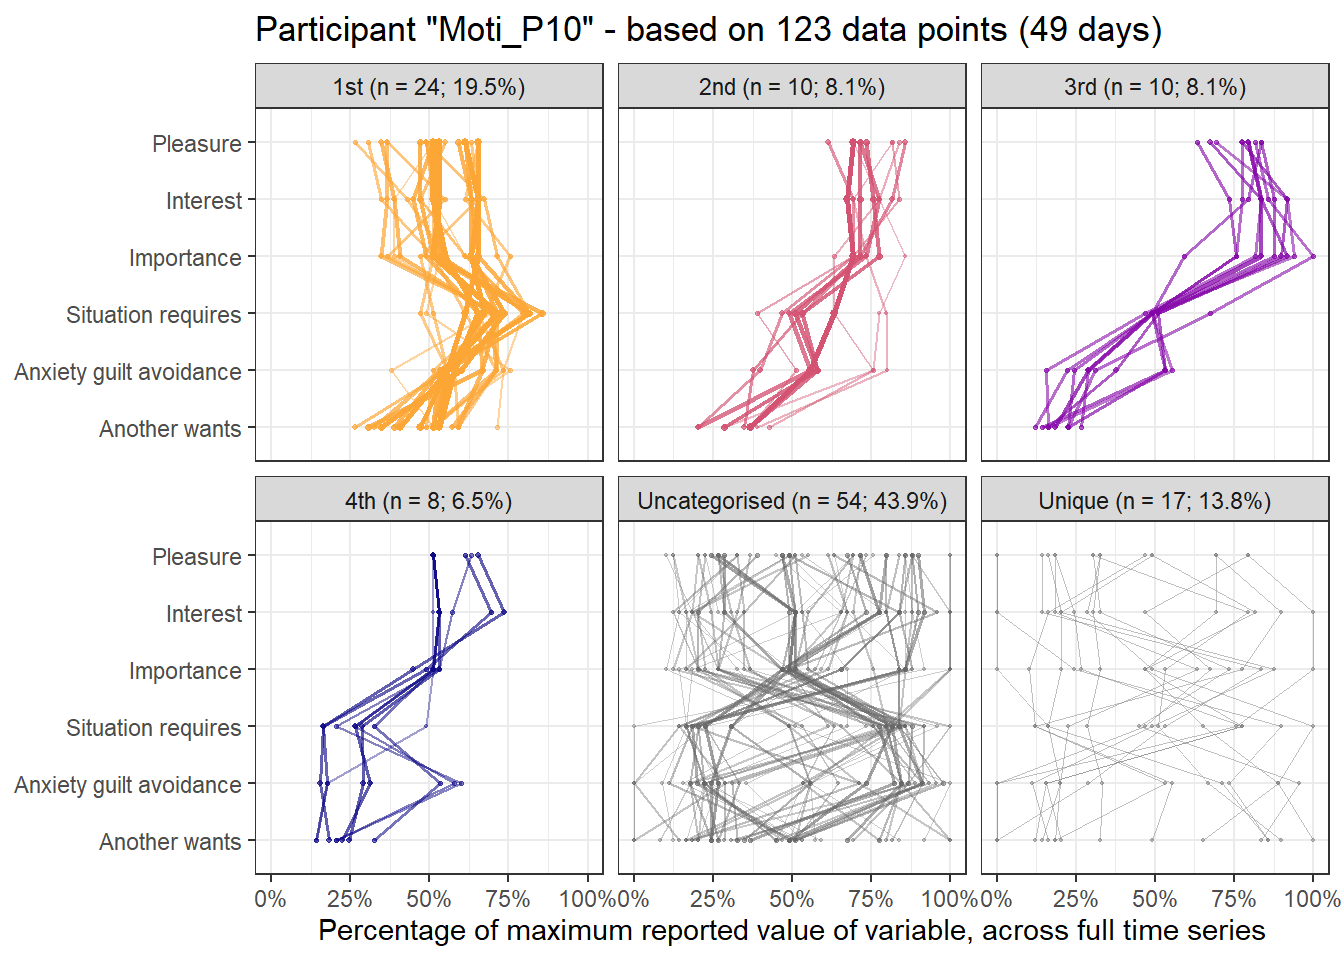
# emadata_nested_wrangled_both_recnets_nodes_plots$all_nodes_with_strengths[[1]]Task-normed data
Here’s the 6-dimensional motivation system’s recurrence plot, weighted by similarity.
set.seed(1)

#######################

# si = similarity under the radius
emadata_nested_wrangled_both_recnets <- emadata_nested_wrangled %>%
  dplyr::mutate(RN = purrr::map(.x = taskNormed_standardised,
                                .f =  ~casnet::rn(.x %>% dplyr::select(#autonomy, competence, relatedness,
                                                                       pleasure, interest, importance,
                                                                       situation_requires,
                                                                       anxiety_guilt_avoidance,
                                                                       another_wants),
                                                  doEmbed = FALSE,
                                                  weighted = TRUE,
                                                  weightedBy = "si",
                                                  emRad = NA)))
##
## Auto-recurrence: Setting diagonal to (1 + max. distance) for analyses
##
## Searching for a radius that will yield 0.05 for RR

emadata_nested_wrangled_both_recnets <- emadata_nested_wrangled_both_recnets %>%
  dplyr::mutate(graph_from_adjacency = purrr::map(.x = RN,
                                                  .f = ~igraph::graph_from_adjacency_matrix(.x,
                                                                                            weighted = TRUE,
                                                                                            mode = "upper",
                                                                                            diag = FALSE)))

# Edges with their distances
emadata_nested_wrangled_both_recnets <- emadata_nested_wrangled_both_recnets %>%
  dplyr::mutate(edges_with_distances = purrr::map(.x = graph_from_adjacency,
                                                  .f = ~igraph::E(.x)$weight),
                graph_from_adjacency_orig = graph_from_adjacency)

# Larger values are closer to the state; inverse of weight makes it more intuitive
for (i in 1:nrow(emadata_nested_wrangled_both_recnets)) {
igraph::E(emadata_nested_wrangled_both_recnets$graph_from_adjacency[[i]])$weight <- (1/emadata_nested_wrangled_both_recnets$edges_with_distances[[i]])
}
# A later note to self: Now weight is a measure of distance; how far apart two time points are
# (under the radius, i.e. they're reasonably similar to begin with)

####### To check:
# igraph::E(emadata_nested_wrangled_both_recnets$graph_from_adjacency[[1]])$weight
# igraph::E(emadata_nested_wrangled_both_recnets$graph_from_adjacency_orig[[1]])$weight

emadata_nested_wrangled_both_recnets <- emadata_nested_wrangled_both_recnets %>%
  dplyr::mutate(RN_plot = purrr::map(.x = RN,
                                .f =  ~casnet::rn_plot(.x,
                                                       plotDimensions = TRUE,
                                                       xlab = "6-dimensional motivation system",
                                                       ylab = "6-dimensional motivation system")))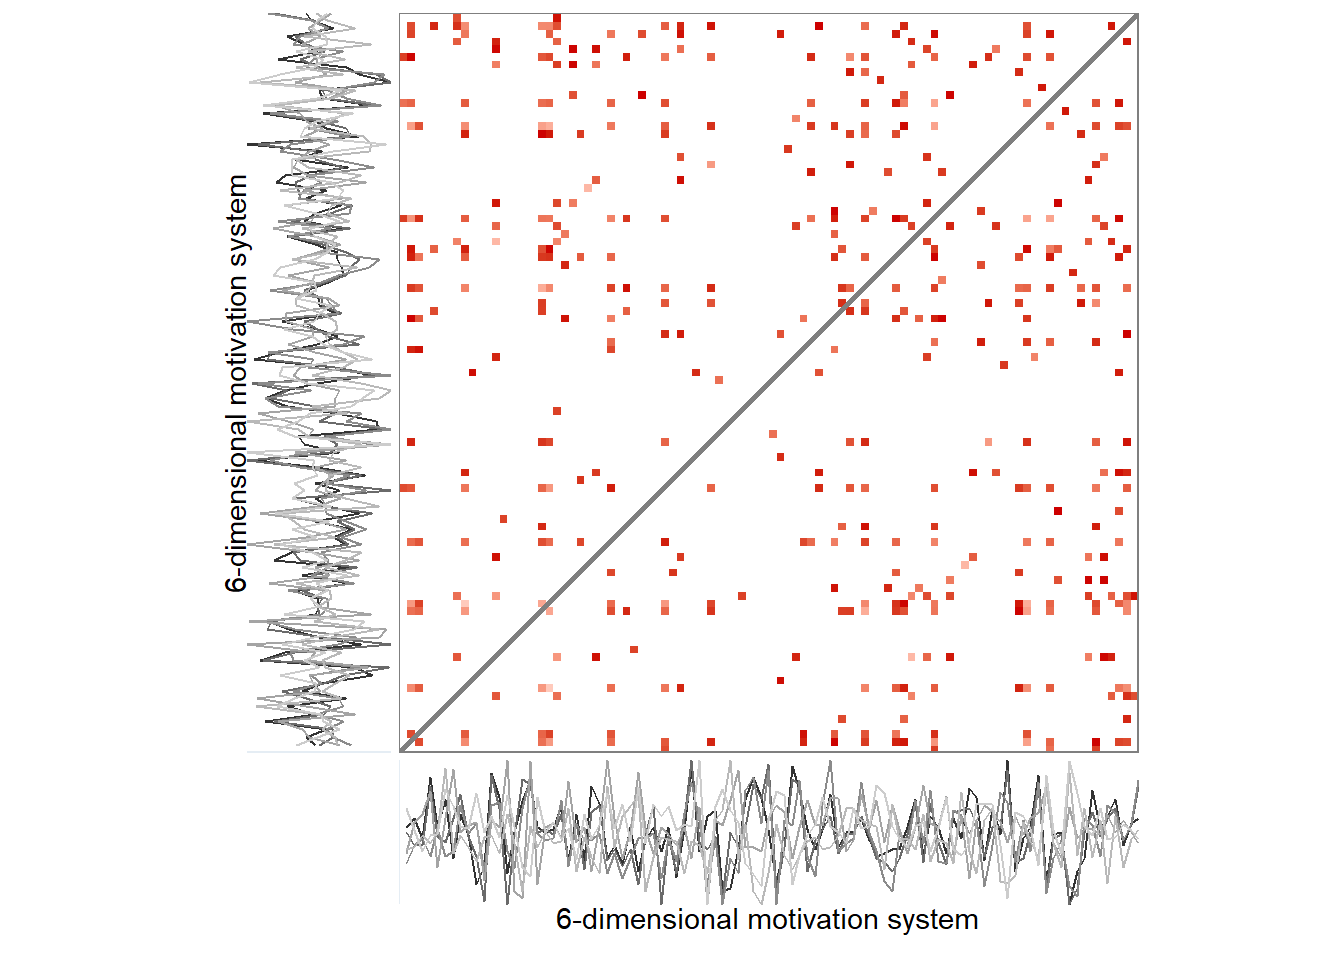
# Make node size equal to strength. Strength is the sum of a node's edge weights.
for (i in 1:nrow(emadata_nested_wrangled_both_recnets)) {
igraph::V(emadata_nested_wrangled_both_recnets$graph_from_adjacency[[i]])$size <- (igraph::strength(emadata_nested_wrangled_both_recnets$graph_from_adjacency[[i]]))
}

# Rescaling weight as "width"; varies between 5 and 10
for (i in 1:nrow(emadata_nested_wrangled_both_recnets)) {
igraph::E(emadata_nested_wrangled_both_recnets$graph_from_adjacency[[i]])$width <-
  casnet::elascer(igraph::E(emadata_nested_wrangled_both_recnets$graph_from_adjacency[[i]])$weight, lo = 5, hi = 10)
}
The lengthy code chunk below extracts and marks attractors in the data.
# Get number of maximally connected node
emadata_nested_wrangled_both_recnets_nodes <- emadata_nested_wrangled_both_recnets %>%
dplyr::mutate(strongest_day = purrr::map(.x = graph_from_adjacency,
.f = ~which.max(igraph::strength(.x))
))
emadata_nested_wrangled_both_recnets_nodes <- emadata_nested_wrangled_both_recnets_nodes %>%
dplyr::mutate(list_of_edges = purrr::map(.x = graph_from_adjacency,
.f = ~igraph::get.data.frame(.x)
))
emadata_nested_wrangled_both_recnets_nodes <- emadata_nested_wrangled_both_recnets_nodes %>%
dplyr::mutate(all_nodes_with_strengths =
purrr::map2(.x = taskNormed_standardised,
.y = graph_from_adjacency,
.f = ~{
data.frame(.x %>%
dplyr::select(#autonomy, competence, relatedness,
pleasure, interest, importance,
situation_requires, anxiety_guilt_avoidance, another_wants),
strength = igraph::strength(.y)) %>%
dplyr::mutate(time = dplyr::row_number()) %>%
tidyr::pivot_longer(cols = c(-strength, -time))
}
))
# Extract nodes (i.e. times) which connect to the strongest (i.e. most connected) node
emadata_nested_wrangled_both_recnets_nodes <- emadata_nested_wrangled_both_recnets_nodes %>%
dplyr::mutate(connecting_to_strongest = purrr::map2(.x = list_of_edges,
.y = strongest_day,
.f = ~{
.x %>% dplyr::filter(from == .y | to == .y) %>%
dplyr::arrange(weight) %>%
tidyr::pivot_longer(cols = c(from, to),
values_to = "node") %>%
dplyr::distinct(node,
#.keep_all = TRUE
) %>%
dplyr::pull(node)
}
)
)
emadata_nested_wrangled_both_recnets_nodes <- emadata_nested_wrangled_both_recnets_nodes %>%
dplyr::mutate(all_nodes_with_strengths = purrr::map2(.x = all_nodes_with_strengths,
.y = connecting_to_strongest,
.f = ~{
dplyr::mutate(.x,
connecting_to_strongest =
dplyr::case_when(time %in% .y ~ TRUE,
TRUE ~ FALSE))
}
))
# Get number of 2nd maximally connected node, which doesn't connect to the 1st
emadata_nested_wrangled_both_recnets_nodes <- emadata_nested_wrangled_both_recnets_nodes %>%
dplyr::mutate(secondary_attractor_day = purrr::map2(.x = graph_from_adjacency,
.y = connecting_to_strongest,
.f = ~{
data.frame(strength = igraph::strength(.x),
time = 1:length(igraph::strength(.x))) %>%
dplyr::filter(!time %in% .y) %>%
dplyr::arrange(desc(strength)) %>%
dplyr::slice(1) %>%
dplyr::pull(time)
}
))
# Extract nodes (i.e. times) which connect to the 2nd strongest node, which doesn't connect to the 1st
emadata_nested_wrangled_both_recnets_nodes <- emadata_nested_wrangled_both_recnets_nodes %>%
dplyr::mutate(connecting_to_2nd_strongest = purrr::map2(.x = list_of_edges,
.y = secondary_attractor_day,
.f = ~{
.x %>% dplyr::filter(from == .y | to == .y) %>%
dplyr::arrange(weight) %>%
tidyr::pivot_longer(cols = c(from, to),
values_to = "node") %>%
dplyr::distinct(node,
#.keep_all = TRUE
) %>%
dplyr::pull(node)
}
)
)
# Save as a variable in the dataset
emadata_nested_wrangled_both_recnets_nodes <- emadata_nested_wrangled_both_recnets_nodes %>%
dplyr::mutate(all_nodes_with_strengths = purrr::map2(.x = all_nodes_with_strengths,
.y = connecting_to_2nd_strongest,
.f = ~{
dplyr::mutate(.x,
connecting_to_2nd_strongest =
dplyr::case_when(time %in% .y ~ TRUE,
TRUE ~ FALSE))
}
))
# Get number of 3rd maximally connected node, which doesn't connect to the 1st or second
emadata_nested_wrangled_both_recnets_nodes <- emadata_nested_wrangled_both_recnets_nodes %>%
dplyr::mutate(tertiary_attractor_day = purrr::pmap(list(..1 = graph_from_adjacency,
..2 = connecting_to_strongest,
..3 = connecting_to_2nd_strongest),
.f = ~{
data.frame(strength = igraph::strength(..1),
time = 1:length(igraph::strength(..1))) %>%
dplyr::filter(!time %in% ..2,
!time %in% ..3) %>%
dplyr::arrange(desc(strength)) %>%
dplyr::slice(1) %>%
dplyr::pull(time)
}
))
# Extract nodes (i.e. times) which connect to the 3rd strongest node
emadata_nested_wrangled_both_recnets_nodes <- emadata_nested_wrangled_both_recnets_nodes %>%
dplyr::mutate(connecting_to_3rd_strongest = purrr::map2(.x = list_of_edges,
.y = tertiary_attractor_day,
.f = ~{
.x %>% dplyr::filter(from == .y | to == .y) %>%
dplyr::arrange(weight) %>%
tidyr::pivot_longer(cols = c(from, to),
values_to = "node") %>%
dplyr::distinct(node,
#.keep_all = TRUE
) %>%
dplyr::pull(node)
}
)
)
# Save as a variable
emadata_nested_wrangled_both_recnets_nodes <- emadata_nested_wrangled_both_recnets_nodes %>%
dplyr::mutate(all_nodes_with_strengths = purrr::map2(.x = all_nodes_with_strengths,
.y = connecting_to_3rd_strongest,
.f = ~{
dplyr::mutate(.x,
connecting_to_3rd_strongest =
dplyr::case_when(time %in% .y ~ TRUE,
TRUE ~ FALSE))
}
))
# Get number of 4th maximally connected node, which doesn't connect to the 1st, 2nd, or 3rd
emadata_nested_wrangled_both_recnets_nodes <- emadata_nested_wrangled_both_recnets_nodes %>%
dplyr::mutate(fourth_attractor_day = purrr::pmap(list(..1 = graph_from_adjacency,
..2 = connecting_to_strongest,
..3 = connecting_to_2nd_strongest,
..4 = connecting_to_3rd_strongest),
.f = ~{
data.frame(strength = igraph::strength(..1),
time = 1:length(igraph::strength(..1))) %>%
dplyr::filter(!time %in% ..2,
!time %in% ..3,
!time %in% ..4) %>%
dplyr::arrange(desc(strength)) %>%
dplyr::slice(1) %>%
dplyr::pull(time)
}
))
# Extract nodes (i.e. times) which connect to the 4th strongest node
emadata_nested_wrangled_both_recnets_nodes <- emadata_nested_wrangled_both_recnets_nodes %>%
dplyr::mutate(connecting_to_4th_strongest = purrr::map2(.x = list_of_edges,
.y = fourth_attractor_day,
.f = ~{
.x %>% dplyr::filter(from == .y | to == .y) %>%
dplyr::arrange(weight) %>%
tidyr::pivot_longer(cols = c(from, to),
values_to = "node") %>%
dplyr::distinct(node,
#.keep_all = TRUE
) %>%
dplyr::pull(node)
}
)
)
# Save as a variable
emadata_nested_wrangled_both_recnets_nodes <- emadata_nested_wrangled_both_recnets_nodes %>%
dplyr::mutate(all_nodes_with_strengths = purrr::map2(.x = all_nodes_with_strengths,
.y = connecting_to_4th_strongest,
.f = ~{
dplyr::mutate(.x,
connecting_to_4th_strongest =
dplyr::case_when(time %in% .y ~ TRUE,
TRUE ~ FALSE))
}
))
################### Make plots
emadata_nested_wrangled_both_recnets_nodes_plots <- emadata_nested_wrangled_both_recnets_nodes %>%
dplyr::mutate(all_nodes_with_strengths =
purrr::map(.x = all_nodes_with_strengths,
.f = ~{
dplyr::mutate(.x,
attractors = dplyr::case_when(
strength == 0 ~ "Unique",
connecting_to_strongest == TRUE ~ "1st",
connecting_to_2nd_strongest == TRUE ~ "2nd",
connecting_to_3rd_strongest == TRUE ~ "3rd",
connecting_to_4th_strongest == TRUE ~ "4th",
TRUE ~ "Uncategorised"),
attractors = factor(attractors,
levels = c("1st",
"2nd",
"3rd",
"4th",
"Uncategorised",
"Unique")),
name = factor(name,
levels = c("pleasure",
"interest",
"importance",
"situation_requires",
"anxiety_guilt_avoidance",
"another_wants"),
labels = c("Pleasure",
"Interest",
"Importance",
"Situation requires",
"Anxiety guilt avoidance",
"Another wants")) %>%
forcats::fct_drop()) %>%
dplyr::group_by(attractors, name) %>%
dplyr::mutate(n = n()) %>%
dplyr::ungroup() %>%
dplyr::mutate(maxtime = max(time),
percentage_of_total =
(n / maxtime) %>% scales::percent(accuracy = 0.1),
proportion_of_total = n/maxtime,
attractors_n =
factor(paste0(attractors,
" (n = ", n, "; ",
percentage_of_total, ")")))
}
))Spiral graph with colored nodes
emadata_nested_wrangled_both_recnets_nodes_plots <- emadata_nested_wrangled_both_recnets_nodes_plots %>%
  dplyr::mutate(node_colors = purrr::map(.x = all_nodes_with_strengths,
                                         .f = ~{tidyr::pivot_wider(.x, names_from = name) %>%
                                             dplyr::pull(attractors)}))

for (i in 1:nrow(emadata_nested_wrangled_both_recnets_nodes_plots)) {
levels(emadata_nested_wrangled_both_recnets_nodes_plots$node_colors[[i]]) <-
  c(viridisLite::plasma(4,
                      end = 0.8,
                      direction = -1), "gray48", "white")
  }

emadata_nested_wrangled_both_recnets_nodes_plots <- emadata_nested_wrangled_both_recnets_nodes_plots %>%
  dplyr::mutate(spiralgraph_epochs = purrr::pmap(list(..1 = graph_from_adjacency,
                                          ..2 = node_colors,
                                          ..3 = User),
                                     .f =  ~casnet::make_spiral_graph(g = ..1,
                                                                      arcs = 4,
                                                                      # a = .1,
                                                                      # b = 2,
                                                                      markTimeBy = TRUE,
                                                                      markEpochsBy = ..2,
                                                                      epochColours = ..2,
                                                                      showEpochLegend = FALSE,
                                                                      scaleEdgeSize = 1/10,
                                                                      scaleVertexSize = c(1, 5),
                                                                      showSizeLegend = FALSE,
                                                                      sizeLabel = "Node strength",
                                                                      type = "Euler",
                                                                      # alphaE = 0.1
                                                                      # title = ..3
                                     )))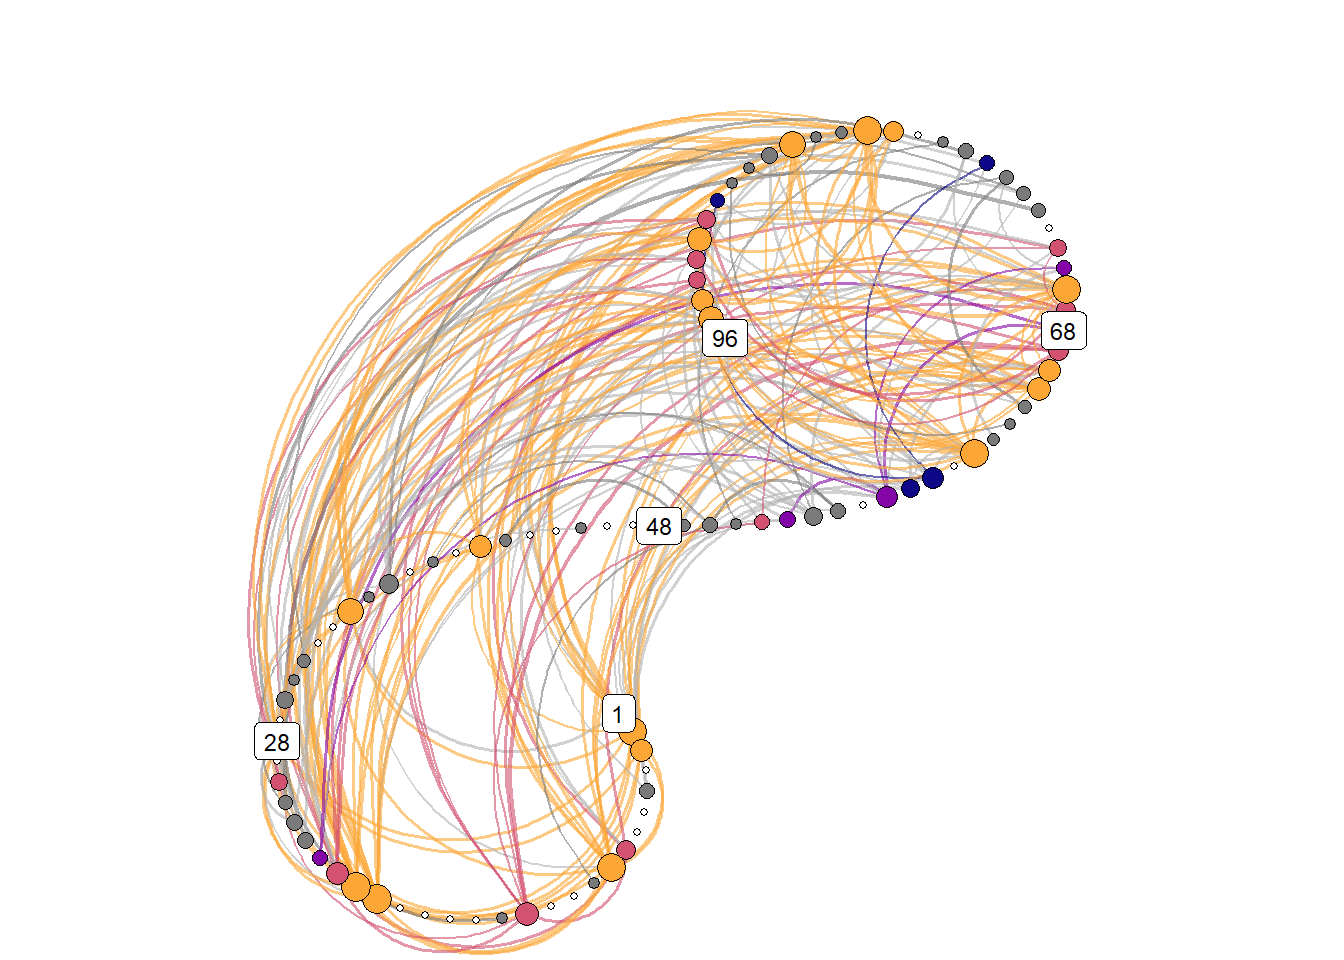
# emadata_nested_wrangled_both_recnets_nodes_plots$spiralgraph_epochs[[1]] +
#   theme(plot.margin=grid::unit(c(0,0,0,0), "mm"))

# ggsave(filename = "./figures/recnetwork.png",
#        width = 7,
#        height = 7)

# emadata_nested_wrangled_both_recnets_nodes_plots$all_nodes_with_strengths[[1]]
Attractor plot
emadata_nested_wrangled_both_recnets_nodes_plots <- emadata_nested_wrangled_both_recnets_nodes_plots %>%
  dplyr::mutate(observations = purrr::map_dbl(.x = taskNormed_standardised,
                                              .f = ~nrow(.)))

emadata_nested_wrangled_both_recnets_nodes_plots <- emadata_nested_wrangled_both_recnets_nodes_plots %>%
  dplyr::mutate(observations_daily = purrr::map_dbl(.x = data_daily,
                                              .f = ~nrow(.)))


emadata_nested_wrangled_both_recnets_nodes_plots <- emadata_nested_wrangled_both_recnets_nodes_plots %>%
  dplyr::mutate(
    attractor_plots =
      purrr::pmap(list(..1 = all_nodes_with_strengths,
                       ..2 = observations,
                       ..3 = observations_daily,
                       ..4 = User),
                  .f = ~{
                    dplyr::mutate(..1,
                                  strength_rescaled =
                                    scales::rescale(strength, to = c(0.3, 1.1)),
                                  alpha_strength = ifelse(strength_rescaled == 0.3,
                                                          0.5,
                                                          strength_rescaled)) %>%
                      ggplot(data = .,
                             aes(x = forcats::fct_rev(name),
                                 y = value,
                                 size = strength_rescaled,
                                 alpha = alpha_strength,
                                 color = attractors_n)) +
                      scale_size_identity() +
                      scale_alpha_identity() +
                      geom_point(aes(alpha = alpha_strength)) +
                      geom_line(aes(group = time,
                                    alpha = alpha_strength)) +
                      scale_color_manual(values = c(viridisLite::plasma(4,
                                                                        end = 0.8,
                                                                        direction = -1),
                                                    "gray40", "gray50")) +
                      scale_y_continuous(labels = scales::label_percent(accuracy = 1)) +
                      theme_bw() +
                      theme(legend.position = "none") +
                      labs(y = "Percentage of maximum reported value of variable, across full time series",
                           x = NULL,
                           title = paste0("Participant \"", ..4, "\" - based on ", ..2, " data points (", ..3, " days)")) +
                      facet_wrap(~attractors_n) +
                      coord_flip(ylim = c(0, 1))
                  }
      ))

emadata_nested_wrangled_both_recnets_nodes_plots$attractor_plots[[1]]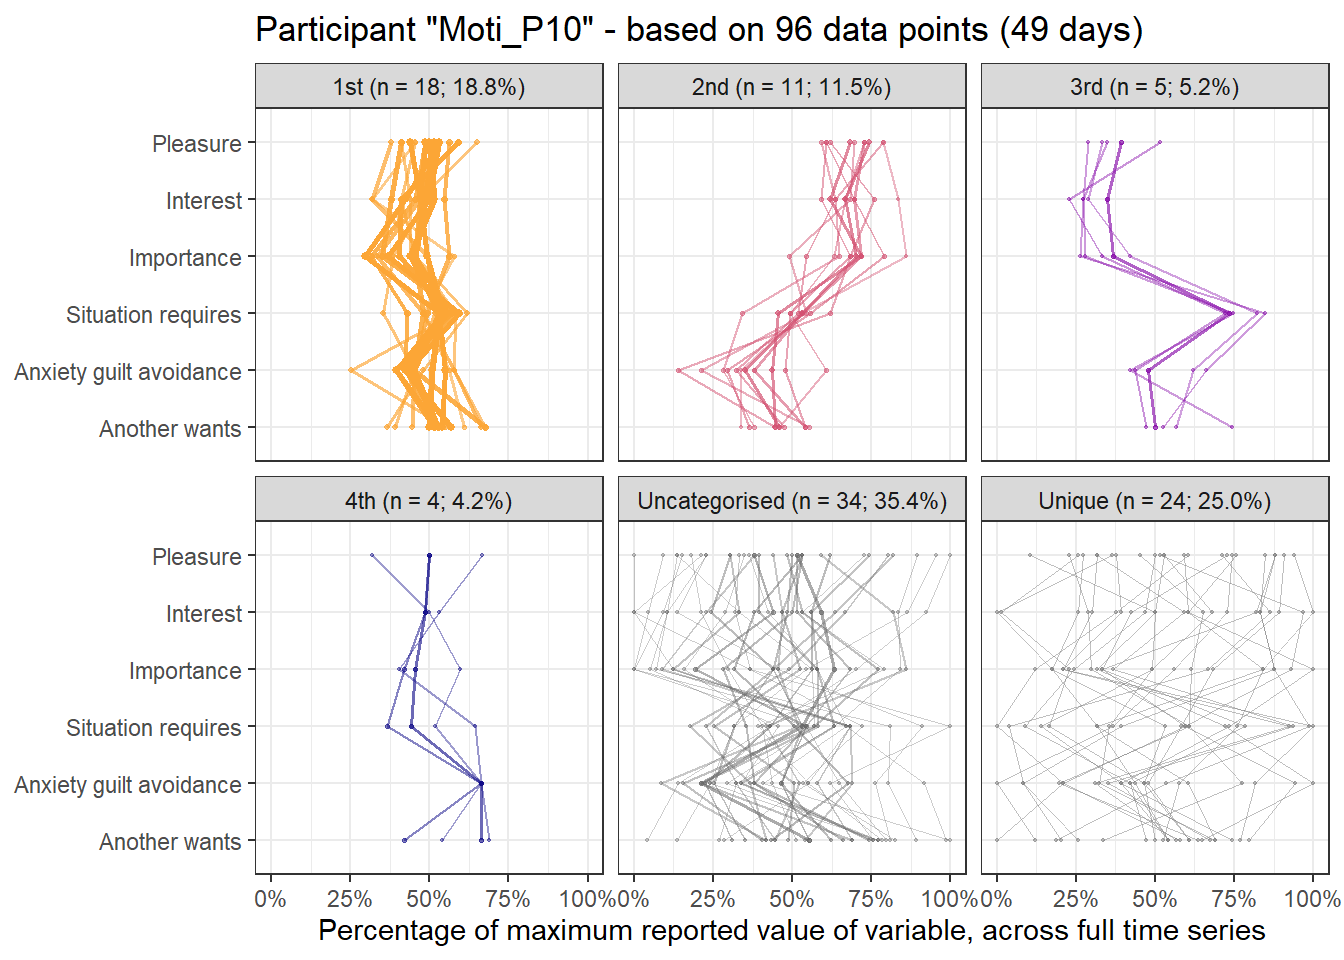
# emadata_nested_wrangled_both_recnets_nodes_plots$all_nodes_with_strengths[[1]]\(~\)
Which tasks do attractors consist of?
As the ecological momentary assessment questions are formulated according to self-determination theory in such a way, that they inquire one’s motivation to do a particular task, it would be intuitive to think each task falls into a particular profile.
We can examine this, as each time the participant responded to the questionnaire, they also indicated, which task they were performing at the moment. These responses were coarse-grained to ensure anonymity. In collaboration with the participant, highly specific tasks that were considered similar enough, were combined under a more general descriptive label. One task, “Moti_P10_1”, could not be fit in any category but was highly specific, so it was anonymised.
Lists below indicate, which tasks each attractor consists of.
taskdata <- firstlast_emadata_nested_wrangled_both_recnets_nodes_plots$all_nodes_with_strengths[[1]] %>%
  tidyr::pivot_wider(names_from = name, values_from = value)

taskdata$own_question <-
emadata_nested_wrangled_both_recnets_nodes_plots$data_extremes[[4]]$own_question

# n_tasks <- emadata_nested_wrangled_both_recnets_nodes_plots$data_with_tasks_and_dates[[11]] %>%
#   tidyr::pivot_longer(cols = task) %>%
#   dplyr::count(name, value) %>%
#   nrow()

# Binarise task variable into 1/0
task_n_by_date <- firstlast_emadata_nested_wrangled_both_recnets_nodes_plots$
                    data_firstlast_divided_by_max_with_tasks_and_dates[[1]]  %>%
  dplyr::mutate(value = 1,
                col_temp = paste0("task_", task)) %>%
  tidyr::pivot_wider(names_from = col_temp,
                     values_from = value,
                     values_fill = list(value = 0)) %>%
  ### If multiple per day and you want daily sums:
  # dplyr::group_by(date) %>%
  # dplyr::summarise_at(vars(contains("task_")), funs(sum)) %>%
  dplyr::mutate(time = row_number())

taskdata_full <- dplyr::full_join(taskdata, task_n_by_date, by = "time")

taskdata_tasks <- taskdata_full %>%
  dplyr::group_by(attractors) %>%
  dplyr::summarise_at(vars(contains("task_")), sum, na.rm = TRUE) %>%
  tidyr::pivot_longer(-attractors) %>%
  dplyr::group_by(attractors) %>%
  dplyr::mutate(name = stringr::str_replace(name, "task_", ""),
                prop = (value / sum(value)) %>% round(3),
                perc = paste0(prop * 100, " %"),
                nameperc = paste0(name, " (", perc, ")")) %>%
  dplyr::filter(prop != 0,
                prop > 0.01) %>%
  dplyr::arrange(desc(prop)) %>%
  dplyr::group_by(attractors) %>%
  dplyr::mutate(n = sum(value),
                attractors_n = paste0(attractors, " (n = ", n, ")")) %>%
  dplyr::ungroup() %>%
  dplyr::select(attractors_n, nameperc) %>%
  dplyr::group_by(attractors_n) %>%
  tidyr::nest() %>%
  dplyr::arrange(attractors_n)


taskdata_tasks_named <- taskdata_tasks %>%
  dplyr::mutate(data = purrr::map2(.x = data,
                                   .y = attractors_n,
                                   .f = ~purrr::set_names(.x, nm = .y)))

for(i in 1:(taskdata_tasks_named$data %>% length)){
taskdata_tasks_named$data[i] %>% knitr::kable() %>% show()
}
|
|
|
|
|
|
# taskdata_tasks_named <- purrr::set_names(taskdata_tasks$data, nm = taskdata_tasks$attractors)In line with Navarro et al. (2013), it seems that the task-dependence of profiles is mostly not true, and they are indeed quite heterogeneous in terms of tasks – that is, within tasks there are several possible motivational profiles, and motivation profiles consist of several different tasks (see next section).
Navarro, J., Curioso, F., Gomes, D., Arrieta, C., & Cortes, M. (2013). Fluctuations in work motivation: tasks do not matter! Nonlinear Dynamics, Psychology, and Life Sciences, 17(1), 3–22.
\(~\)
Most frequent tasks and their attractors
Plot below shows how the most common tasks for this participant fall within the attractors.
top_tasks <- taskdata_full %>%
  dplyr::group_by(task) %>%
  dplyr::summarise(n = n()) %>%
  dplyr::arrange(desc(n)) %>%
  dplyr::slice(1:5) %>%
  dplyr::pull(task)

taskdata_full %>%
  dplyr::filter(task %in% top_tasks) %>%
  ggplot(aes(x = Date, y = attractors)) +
  geom_point(aes(shape = task,
                 colour = task),
             position = position_dodge(#height = 0.2,
                                        width = 0.4)) +
  # geom_line(aes(group = task)) +
  scale_x_datetime(name = NULL,
                   date_breaks = "1 month",
                   date_labels = "%F") +
  scale_colour_viridis_d(end = 0.9) +
  theme_bw() +
  geom_hline(yintercept = c(1.5, 2.5, 3.5, 4.5, 5.5)) +
  scale_y_discrete(name = "Attractor",
                   limits = rev(levels(taskdata_full$attractors))) +
  theme(panel.grid.major.y = element_blank()) +
  coord_cartesian(ylim = c(1, 6)) +
  labs(title = "Most frequent tasks for this participant")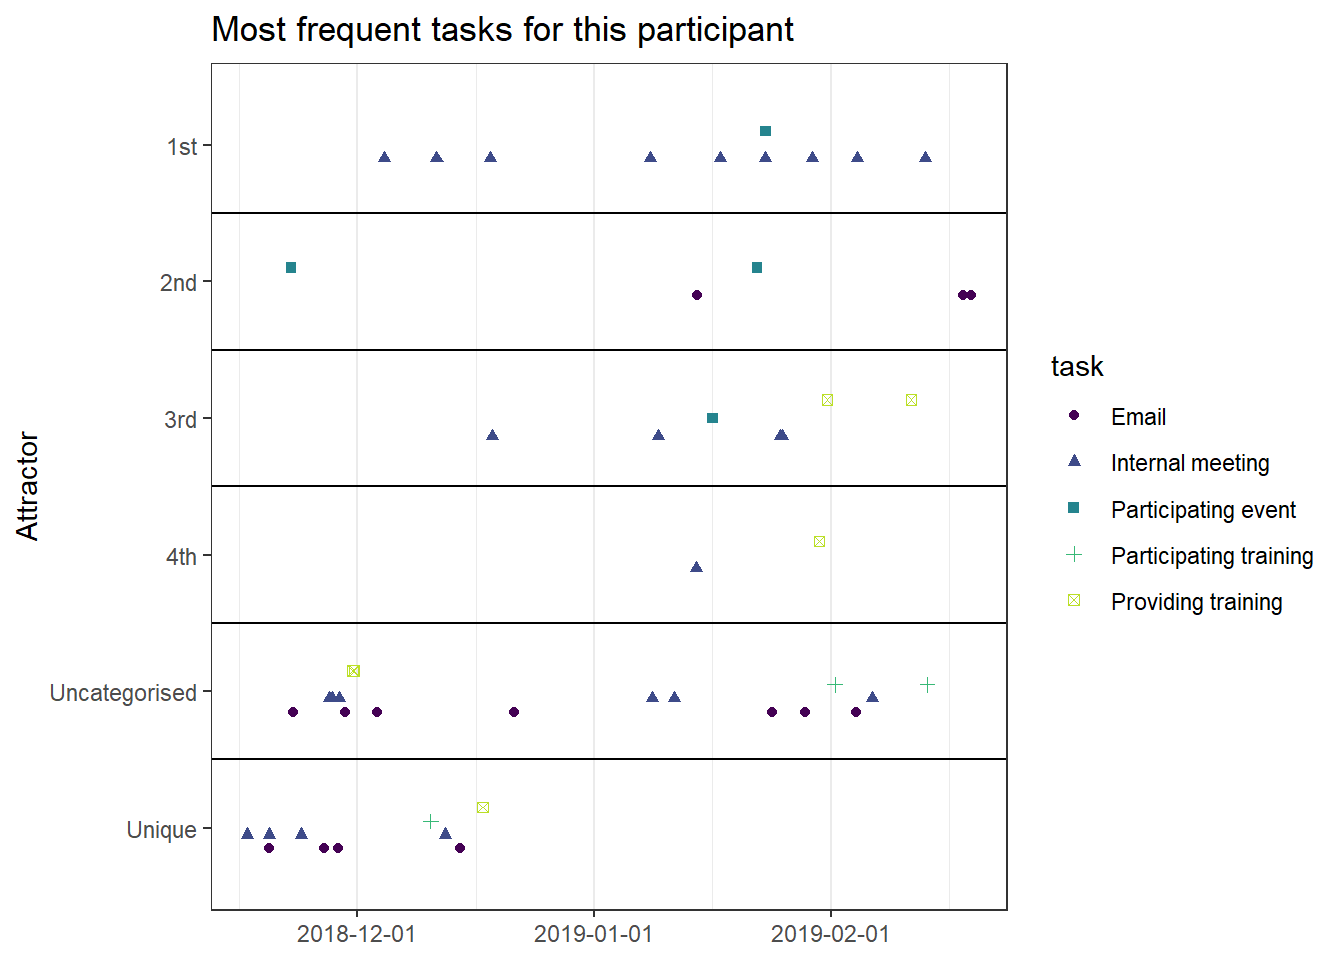
We can see, that no task consistently falls in one attractor.
\(~\)
All tasks with their temporal positions
Figures below show this participant’s tasks and when they take place.
Tasks in the analysis (first and last daily observations)
# Weekends to be darkened:
dateRanges <- data.frame(
  start = seq(as.POSIXct("1900-11-02 19:00:00"), as.POSIXct("2100-11-02 19:00:00"), "1 week"),
  end = seq(as.POSIXct("1900-11-05 05:00:00"), as.POSIXct("2100-11-05 05:00:00"), "1 week"))

dateRanges$startDay <- weekdays(dateRanges$start)
dateRanges$endDay <- weekdays(dateRanges$end)

taskdata_full <- emadata_nested_wrangled_both_recnets_nodes_plots$
                  data_firstlast_divided_by_max_with_tasks_and_dates[[1]]

taskdata_full %>%
  dplyr::mutate(task_orig = task) %>%
  dplyr::group_by(task_orig) %>%
  dplyr::mutate(task_n = n(),
                task = paste0(task, " (n = ", task_n, ")")) %>%
  dplyr::ungroup() %>%
  dplyr::select(task, Date) %>%
  dplyr::arrange(Date) %>%
  dplyr::filter(!is.na(task)) %>%
  dplyr::mutate(# task = forcats::fct_lump(.$task, n = 25, ties.method = "first", other_level = "Muu"),
                task = reorder(task, task, FUN = length)) %>%
  dplyr::group_by(as.Date(Date)) %>%
  dplyr::mutate(consecutive = ifelse(lag(task) == task, TRUE, FALSE)) %>%
  ggplot(aes(x = Date, y = task)) +
  # The consecutiveness connector does not work for some reason:
  # geom_line(aes(alpha = consecutive, group = task)) +
  # scale_alpha_manual(values=c(0, 1), breaks=c(FALSE, TRUE), guide='none') +
  geom_point(aes(color = task), shape = 124, stroke = 0.08, size = 3)  +
  theme_bw() +
  geom_rect(data = dateRanges,
          aes(xmin = (start) + 1, xmax = (end) - 1, ymin = -Inf, ymax = Inf),
          inherit.aes = FALSE, alpha = 0.5, fill = c("gray90")) + # see https://stackoverflow.com/questions/40331685/shading-month-intervals-when-plotting-time-series-data-with-different-start-andtheme_bw()
  theme(axis.text.x=element_text(angle = 270, hjust = 0, size = 5),
        legend.position = "none") +
  scale_x_datetime(date_labels = "%d/%m", date_breaks = "2 days", limits = range(taskdata_full$Date)) +
  labs(x = NULL, y = NULL, title = "Sampled tasks")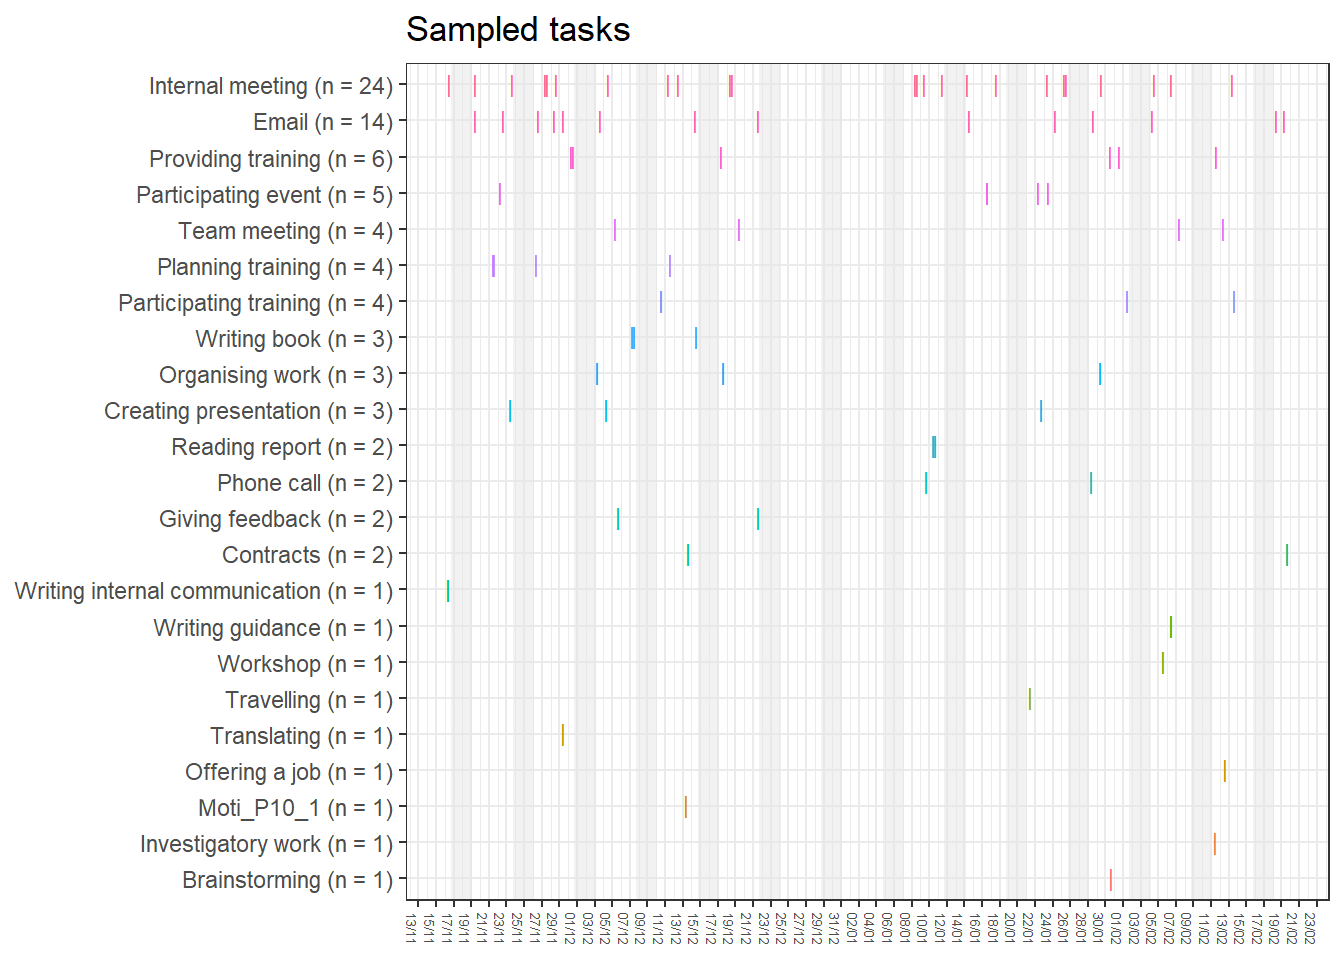
All tasks
# Weekends to be darkened:
dateRanges <- data.frame(
  start = seq(as.POSIXct("1900-11-02 19:00:00"), as.POSIXct("2100-11-02 19:00:00"), "1 week"),
  end = seq(as.POSIXct("1900-11-05 05:00:00"), as.POSIXct("2100-11-05 05:00:00"), "1 week"))

dateRanges$startDay <- weekdays(dateRanges$start)
dateRanges$endDay <- weekdays(dateRanges$end)

taskdata_all <- emadata_nested_wrangled_both_recnets_nodes_plots$
                    data_with_tasks_and_dates[[1]]

taskdata_all %>%
  dplyr::mutate(task_orig = task) %>%
  dplyr::group_by(task_orig) %>%
  dplyr::mutate(task_n = n(),
                task = paste0(task, " (n = ", task_n, ")")) %>%
  dplyr::ungroup() %>%
  dplyr::select(task, Date) %>%
  dplyr::arrange(Date) %>%
  dplyr::filter(!is.na(task)) %>%
  dplyr::mutate(#task = forcats::fct_lump(.$task, n = 25, ties.method = "first", other_level = "Muu"),
                task = reorder(task, task, FUN = length)) %>%
  dplyr::group_by(as.Date(Date)) %>%
  dplyr::mutate(consecutive = ifelse(lag(task) == task, TRUE, FALSE)) %>%
  ggplot(aes(x = Date, y = task)) +
  # The consecutiveness connector does not work for some reason:
  # geom_line(aes(alpha = consecutive, group = task)) +
  # scale_alpha_manual(values=c(0, 1), breaks=c(FALSE, TRUE), guide='none') +
  geom_point(aes(color = task), shape = 124, stroke = 0.08, size = 3)  +
  theme_bw() +
  geom_rect(data = dateRanges,
          aes(xmin = (start) + 1, xmax = (end) - 1, ymin = -Inf, ymax = Inf),
          inherit.aes = FALSE, alpha = 0.5, fill = c("gray90")) + # see https://stackoverflow.com/questions/40331685/shading-month-intervals-when-plotting-time-series-data-with-different-start-andtheme_bw()
  theme(axis.text.x=element_text(angle = 270, hjust = 0, size = 5),
        legend.position = "none") +
  scale_x_datetime(date_labels = "%d/%m", date_breaks = "2 days", limits = range(taskdata_all$Date)) +
  labs(x = NULL, y = NULL, title = "All tasks")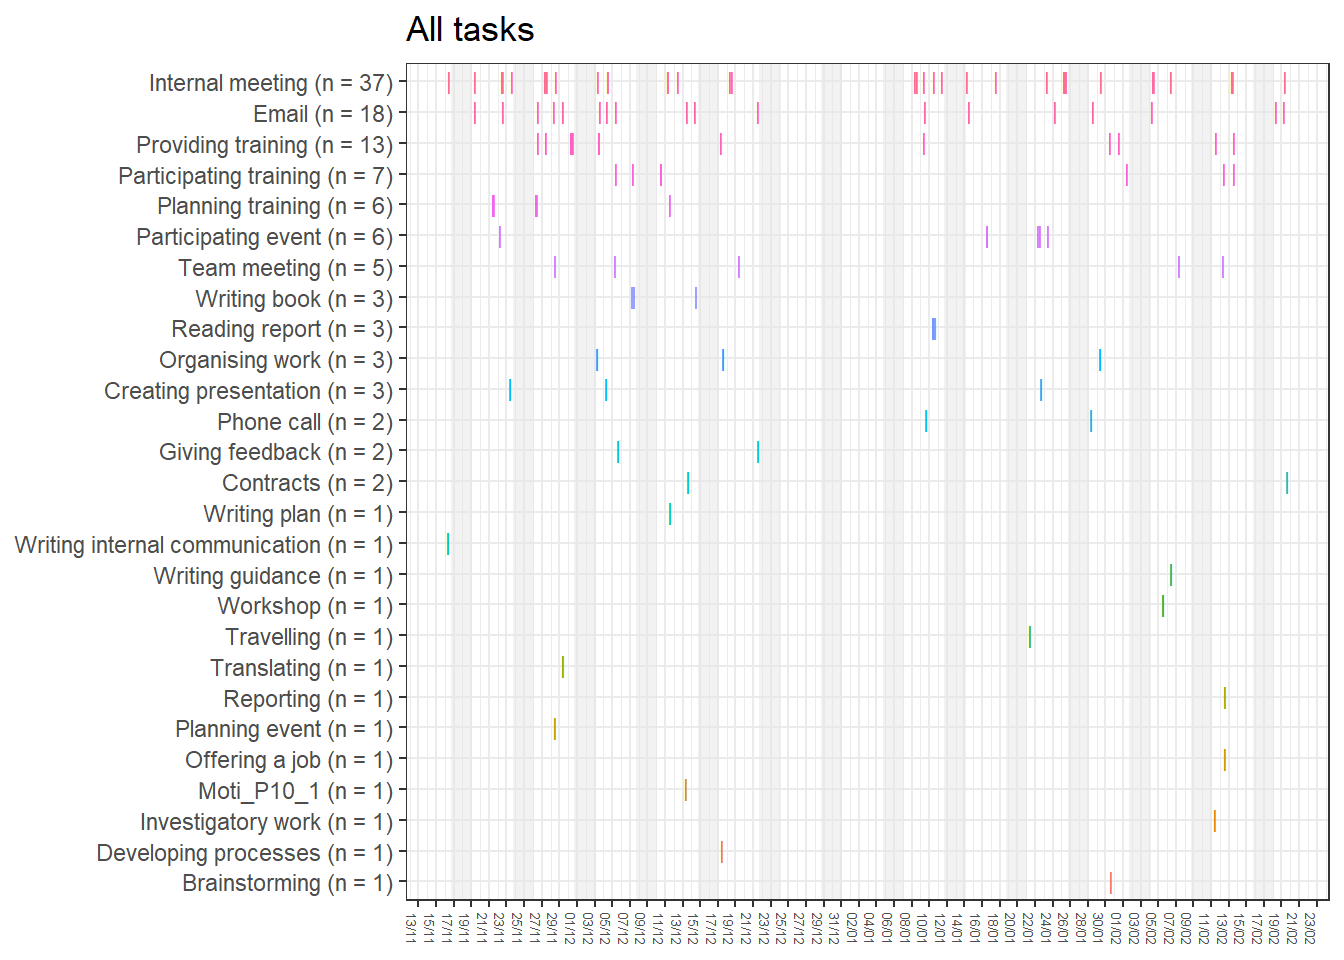
Research questions to be studied with multidimensional recurrence networks:
- How are the variables in the multivariate system connected to each other; what is the structure (i.e. the centrality indices) of the recurrence network, and do behaviour change outcomes depend on it?
- Do new attractors in the multidimensional recurrence network emerge, after an intervention has been implemented?
Recurrence plots
emadata_nested_wrangled_unthresholded <- emadata_nested_wrangled %>%
  dplyr::mutate(unthresholded = purrr::map(.x = data_firstlast_divided_by_max,
                                        .f = ~casnet::rp(.x,
                                                         doEmbed = FALSE)))


emadata_nested_wrangled_unthresholded <- emadata_nested_wrangled_unthresholded %>%
  dplyr::mutate(unthresholded_plot = purrr::map(.x = unthresholded,
                                                .f = ~casnet::rp_plot(.x,
                                                                      title = "A)",
                                                                      xlabel = "6-dimensional motivation system",
                                                                      ylabel = "6-dimensional motivation system",
                                                                      plotRadiusRRbar = FALSE,
                                                                      plotDimensions = TRUE)))

emadata_nested_wrangled_both <- emadata_nested_wrangled_unthresholded %>%
  dplyr::mutate(thresholded = purrr::map(.x = data_firstlast_divided_by_max,
                                        .f = ~casnet::rp(.x,
                                                         doEmbed = FALSE,
                                                         emRad = NA,
                                                         doPlot = TRUE,
                                                         xlabel = " ",
                                                         ylabel = " ")))


# At 15 Dec 2019, crqa_rp is deprecated but called by rp_plot when plotMeasures = TRUE. This hack helps:
crqa_rp <- casnet::rp_measures

emadata_nested_wrangled_both <- emadata_nested_wrangled_both %>%
  dplyr::mutate(thresholded_plot = purrr::map(.x = thresholded,
                                              .f = ~casnet::rp_plot(.x,
                                                                    title = "B)",
                                                                    xlabel = "6-dimensional motivation system",
                                                                    ylabel = "6-dimensional motivation system",
                                                                    plotRadiusRRbar = FALSE,
                                                                    plotDimensions = TRUE,
                                                                    plotMeasures = FALSE)))

emadata_nested_wrangled_both_withMeasures <- emadata_nested_wrangled_both %>%
  dplyr::mutate(measures = purrr::map(.x = thresholded,
                                              .f = ~casnet::rp_measures(.x,
                                                                        emRad = NA)))

rqa_plot <- gridExtra::grid.arrange(
                        emadata_nested_wrangled_both_withMeasures$unthresholded_plot[[1]],
                        emadata_nested_wrangled_both_withMeasures$thresholded_plot[[1]],
                        layout_matrix = matrix(c(1, 2),
                                               nrow = 1, byrow = FALSE))

cowplot::save_plot("./figures/rqa_biplot.png", rqa_plot, dpi = 300)
emadata_nested_wrangled_unthresholded <- emadata_nested_wrangled %>%
dplyr::mutate(unthresholded = purrr::map(.x = data_firstlast_divided_by_max,
.f = ~casnet::rp(.x,
doEmbed = FALSE)))
emadata_nested_wrangled_unthresholded <- emadata_nested_wrangled_unthresholded %>%
dplyr::mutate(unthresholded_plot = purrr::map(.x = unthresholded,
.f = ~casnet::rp_plot(.x,
title = "C)",
xlabel = "6-dimensional motivation system",
ylabel = "6-dimensional motivation system",
plotRadiusRRbar = FALSE,
plotDimensions = TRUE)))
emadata_nested_wrangled_both <- emadata_nested_wrangled_unthresholded %>%
dplyr::mutate(thresholded = purrr::map(.x = data_firstlast_divided_by_max,
.f = ~casnet::rp(.x,
doEmbed = FALSE,
emRad = NA,
doPlot = TRUE,
xlabel = " ",
ylabel = " ")))
# At 15 Dec 2019, crqa_rp is deprecated but called by rp_plot when plotMeasures = TRUE. This hack helps:
crqa_rp <- casnet::rp_measures
emadata_nested_wrangled_both <- emadata_nested_wrangled_both %>%
dplyr::mutate(thresholded_plot = purrr::map(.x = thresholded,
.f = ~casnet::rp_plot(.x,
title = "D)",
xlabel = "6-dimensional motivation system",
ylabel = "6-dimensional motivation system",
plotRadiusRRbar = FALSE,
plotDimensions = TRUE,
plotMeasures = FALSE)))
emadata_nested_wrangled_both_withMeasures <- emadata_nested_wrangled_both %>%
dplyr::mutate(measures = purrr::map(.x = thresholded,
.f = ~casnet::rp_measures(.x,
emRad = NA)))
# Bring all the RQA measures into one data frame (from: https://stackoverflow.com/questions/2851327/convert-a-list-of-data-frames-into-one-data-frame):
complexity_measures <- dplyr::bind_rows(emadata_nested_wrangled_both_withMeasures$measures, .id = "rowNumber")
# User ID is not the same as row number, so take the id from the earlier object:
complexity_measures$userID <- emadata_nested_wrangled_both_withMeasures$User
set.seed(100)
emadata_nested_wrangled_shuffled <- emadata_nested_wrangled %>%
  dplyr::mutate(data_daily_standardised_shuffled =
                  purrr::map(data_firstlast_divided_by_max, ~dplyr::mutate_if(.x, is.numeric,
                                                                         ~(sample(.,
                                                                                  size = length(.),
                                                                                  replace = FALSE)))))

# # These are the same, i.e. shuffling didn't change summary stats:
# emadata_nested_wrangled$data_daily_standardised[[1]] %>% summary()
# emadata_nested_wrangled_shuffled$data_daily_standardised_shuffled[[1]] %>% summary()

emadata_nested_wrangled_unthresholded_shuffled <- emadata_nested_wrangled_shuffled %>%
  dplyr::mutate(unthresholded_shuffled = purrr::map(.x = data_daily_standardised_shuffled,
                                        .f = ~casnet::rp(.x,
                                                         doEmbed = FALSE)))


emadata_nested_wrangled_unthresholded_shuffled <- emadata_nested_wrangled_unthresholded_shuffled %>%
  dplyr::mutate(unthresholded_plot_shuffled = purrr::map(.x = unthresholded_shuffled,
                                                .f = ~casnet::rp_plot(.x,
                                                                      title = "E)",
                                                                      xlabel = "Shuffled system",
                                                                      ylabel = "Shuffled system",
                                                                      plotRadiusRRbar = FALSE,
                                                                      plotDimensions = TRUE)))

emadata_nested_wrangled_both_shuffled <- emadata_nested_wrangled_unthresholded_shuffled %>%
  dplyr::mutate(thresholded_shuffled = purrr::map(.x = data_daily_standardised_shuffled,
                                        .f = ~casnet::rp(.x,
                                                         doEmbed = FALSE,
                                                         emRad = NA,
                                                         doPlot = TRUE,
                                                         xlabel = " ",
                                                         ylabel = " ")))


# At 15 Dec 2019, crqa_rp is deprecated but called by rp_plot when plotMeasures = TRUE. This hack helps:
crqa_rp <- casnet::rp_measures

emadata_nested_wrangled_both_shuffled <- emadata_nested_wrangled_both_shuffled %>%
  dplyr::mutate(thresholded_plot_shuffled = purrr::map(.x = thresholded_shuffled,
                                              .f = ~casnet::rp_plot(.x,
                                                                    title = "F)",
                                                                    xlabel = "Shuffled system",
                                                                    ylabel = "Shuffled system",
                                                                    plotRadiusRRbar = FALSE,
                                                                    plotDimensions = TRUE,
                                                                    plotMeasures = FALSE)))

emadata_nested_wrangled_both_withMeasures_shuffled <- emadata_nested_wrangled_both_shuffled %>%
  dplyr::mutate(measures_shuffled = purrr::map(.x = thresholded_shuffled,
                                              .f = ~casnet::rp_measures(.x,
                                                                        emRad = NA)))
set.seed(999)
emadata_dailyAverages <- emadata_nested_wrangled_both_withMeasures$data_firstlast_divided_by_max[[1]] %>%
  dplyr::mutate(uniform_noise =
                  runif(n = nrow(emadata_nested_wrangled_both_withMeasures$data_firstlast_divided_by_max[[1]]),
                                      min = 0, max = 49))

emRad <- casnet::est_radius(y1 = emadata_dailyAverages$uniform_noise, emLag = 1, emDim = 1)$Radius

# out <- casnet::crqa_cl(emadata_dailyAverages$uniform_noise, emDim = emDim, emLag = emLag, emRad = emRad)

RM <- casnet::rp(y1 = emadata_dailyAverages$uniform_noise, emDim = 1, emLag = 1)

uniform_noise_unthresholded <- casnet::rp_plot(RM,
                                               title = "A)",
                                               xlabel = "Uniform noise",
                                               ylabel = "Uniform noise",
                                               plotRadiusRRbar = FALSE,
                                               drawGrid = FALSE,
                                               plotDimensions = TRUE)

RM_thresholded <- casnet::di2bi(RM, emRad = emRad)

uniform_noise_thresholded <- casnet::rp_plot(RM_thresholded,
                                             title = "B)",
                                             xlabel = "Uniform noise",
                                             ylabel = "Uniform noise",
                                             plotDimensions = TRUE,
                                             plotMeasures = FALSE)
In the figure below: The first column (A-B) is a plot made out of a series of random numbers. The middle column (C-D) depicts the result, where a single participant’s responses on several motivation-related variables are subjected to multi-dimensional Recurrence Quantification Analysis (Wallot, 2019; Wallot et al., 2016; Wallot & Leonardi, 2018). The rightmost column (E-F) represents surrogate data, where the participant’s responses are shuffled to dismantle the temporal structure; this shuffling can be done repeatedly to produce confidence intervals for recurrence-based complexity measures.
Wallot, S., & Leonardi, G. (2018). Analyzing Multivariate Dynamics Using Cross-Recurrence Quantification Analysis (CRQA), Diagonal-Cross-Recurrence Profiles (DCRP), and Multidimensional Recurrence Quantification Analysis (MdRQA) – A Tutorial in R. Frontiers in Psychology, 9. https://doi.org/10.3389/fpsyg.2018.02232
Wallot, S., Roepstorff, A., & Mønster, D. (2016). Multidimensional Recurrence Quantification Analysis (MdRQA) for the Analysis of Multidimensional Time-Series: A Software Implementation in MATLAB and Its Application to Group-Level Data in Joint Action. Frontiers in Psychology, 7. https://doi.org/10.3389/fpsyg.2016.01835
Wallot, S. (2019). Multidimensional Cross-Recurrence Quantification Analysis (MdCRQA) – A Method for Quantifying Correlation between Multivariate Time-Series. Multivariate Behavioral Research, 54(2), 173–191. https://doi.org/10.1080/00273171.2018.1512846
The upper row (panels A, C and E) shows unthresholded distance matrices, where each cell represents a measurement occasion, with red colours indicating the value is close (as measured by Euclidean distance) to the corresponding time point on the other axis, while blue colours indicate the contrary, and white implies an intermediate distance. The lower row (Panels B, D and F) shows recurrence plots, where the unthresholded distance matrices have been binarised—leaving only 5% of the closest points—leading to thresholded plots from which quantitative indicators can be calculated. Black points indicate the same or a similar value (in case of B) or a similar configuration “profile” (in case of D and F) occurring. Because values always recur with themselves, we observe full recurrence in the diagonal line.
rqa_plot <- gridExtra::grid.arrange(uniform_noise_unthresholded,
                        uniform_noise_thresholded,
                        emadata_nested_wrangled_both_withMeasures$unthresholded_plot[[1]],
                        emadata_nested_wrangled_both_withMeasures$thresholded_plot[[1]],
                        emadata_nested_wrangled_both_withMeasures_shuffled$unthresholded_plot_shuffled[[1]],
                        emadata_nested_wrangled_both_withMeasures_shuffled$thresholded_plot_shuffled[[1]],
                        layout_matrix = matrix(c(1, 2, 3,
                                                 4, 5, 6),
                                               nrow = 2, byrow = FALSE))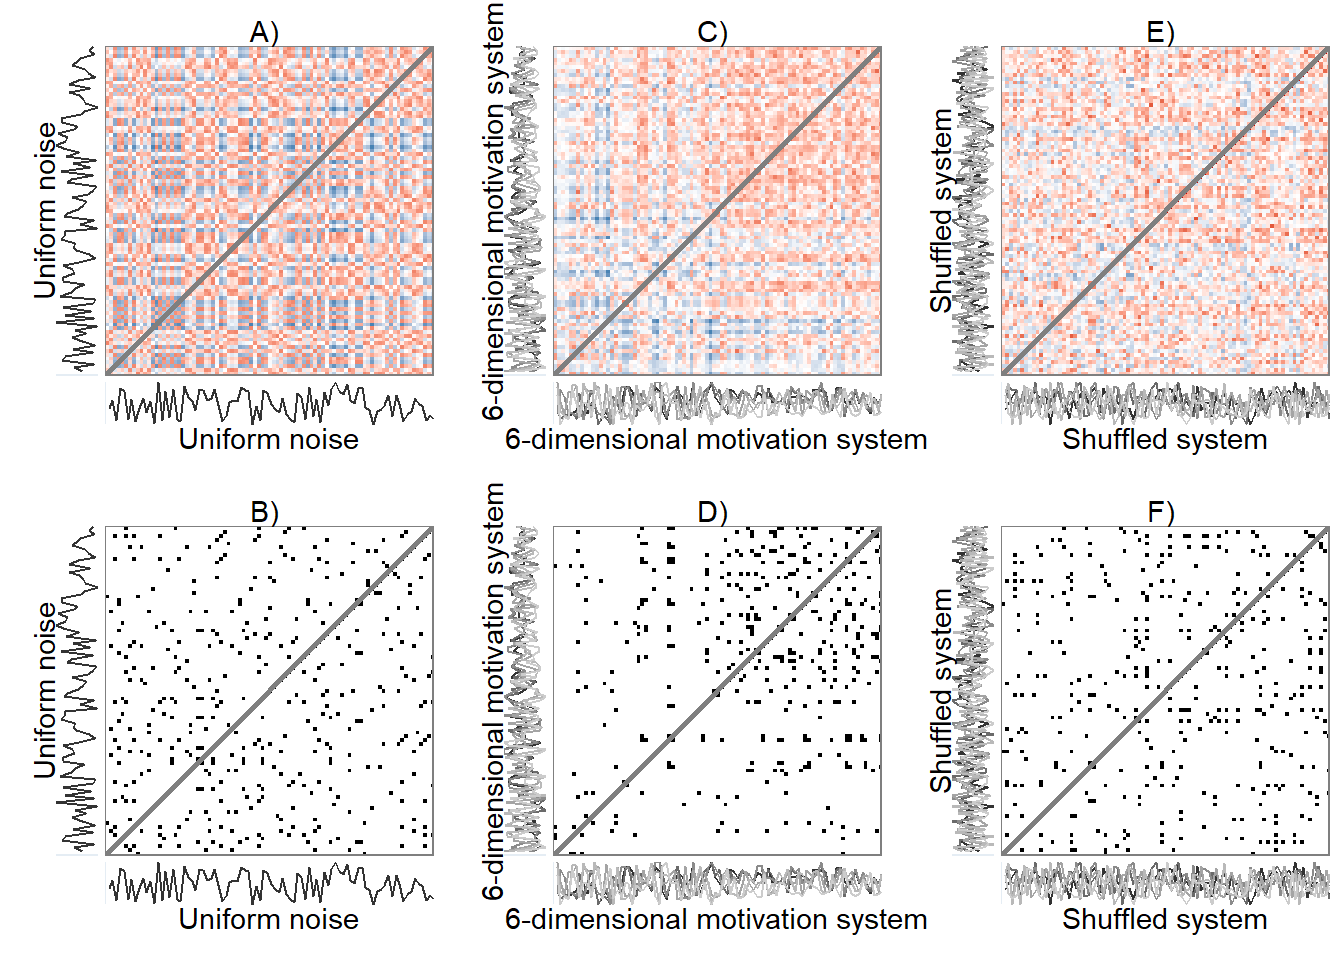
rqa_plot
## TableGrob (2 x 3) "arrange": 6 grobs
##   z     cells    name
## 1 1 (1-1,1-1) arrange
## 2 2 (2-2,1-1) arrange
## 3 3 (1-1,2-2) arrange
## 4 4 (2-2,2-2) arrange
## 5 5 (1-1,3-3) arrange
## 6 6 (2-2,3-3) arrange
##                grob
## 1 gtable[di_rp_dim]
## 2 gtable[bi_rp_dim]
## 3 gtable[di_rp_dim]
## 4 gtable[bi_rp_dim]
## 5 gtable[di_rp_dim]
## 6 gtable[bi_rp_dim]

# ggsave("./figures/rqa_multiplot.png", rqa_plot, width = 11.69, height = 8.27, dpi = 300)
Quantification of temporal patterns is done by extracting complexity measures from line structures in a recurrence plot; the detailed process is beyond the scope here, but fully described in Marwan, Romano, Thiel, & Kurths (pp. 251 and 263-283).
- Marwan, N., Romano, M. C., Thiel, M., & Kurths, J. (2007). Recurrence plots for the analysis of complex systems. Physics Reports, 438(5), 237–329. https://doi.org/10.1016/j.physrep.2006.11.001
The table below shows four complexity measures derived from the three recurrence plots (B, D and F) above. Main difference is in Laminarity; the observed real data has much more points forming vertical lines than either of the comparisons. Notably, Trapping Time indicates the length of these line segments does not differ between conditions.
measures_multiplot <-
  dplyr::bind_rows(emadata_nested_wrangled_both_withMeasures_uniform,
                   emadata_nested_wrangled_both_withMeasures$measures[[1]],
                   emadata_nested_wrangled_both_withMeasures_shuffled$measures_shuffled[[1]]) %>%
  dplyr::mutate(Condition = c("Uniform noise",
                              "6-dimensional motivation system",
                              "Shuffled system")) %>%
  dplyr::select(Condition,
                Determinism = DET,
                Laminarity = LAM_vl, # vl and hl are the same
                "Trapping Time" = TT_vl,
                Entropy = ENT_vl)

measures_multiplot %>% dplyr::mutate_if(is.numeric, round, digits = 3) %>%
knitr::kable(.)| Condition | Determinism | Laminarity | Trapping Time | Entropy | |
|---|---|---|---|---|---|
| 1…1 | Uniform noise | 0.138 | 0.048 | 2.000 | 0.000 |
| 1…2 | 6-dimensional motivation system | 0.091 | 0.243 | 2.022 | 0.107 |
| 1…3 | Shuffled system | 0.065 | 0.067 | 2.083 | 0.287 |
These measures, along with others, are described below.
Recurrence measures
Trend
What it depicts: The stationarity of the system, i.e. whether the recurrent patterns emerge homogenously across the plot (indicating system stationarity), or if they fade to the lower right or and upper left corners (indicating the system changes in time, is non-stationarity). For example, a time series of any gradually but surely increasing or decreasing numbers would show a high trend value, whereas a series in which values fluctuate around more or less the same values, would exhibit a low trend value.
knitr::include_graphics(path = "./figures/RQA_measures/trendlo.PNG")
knitr::include_graphics(path = "./figures/RQA_measures/trendhi.PNG")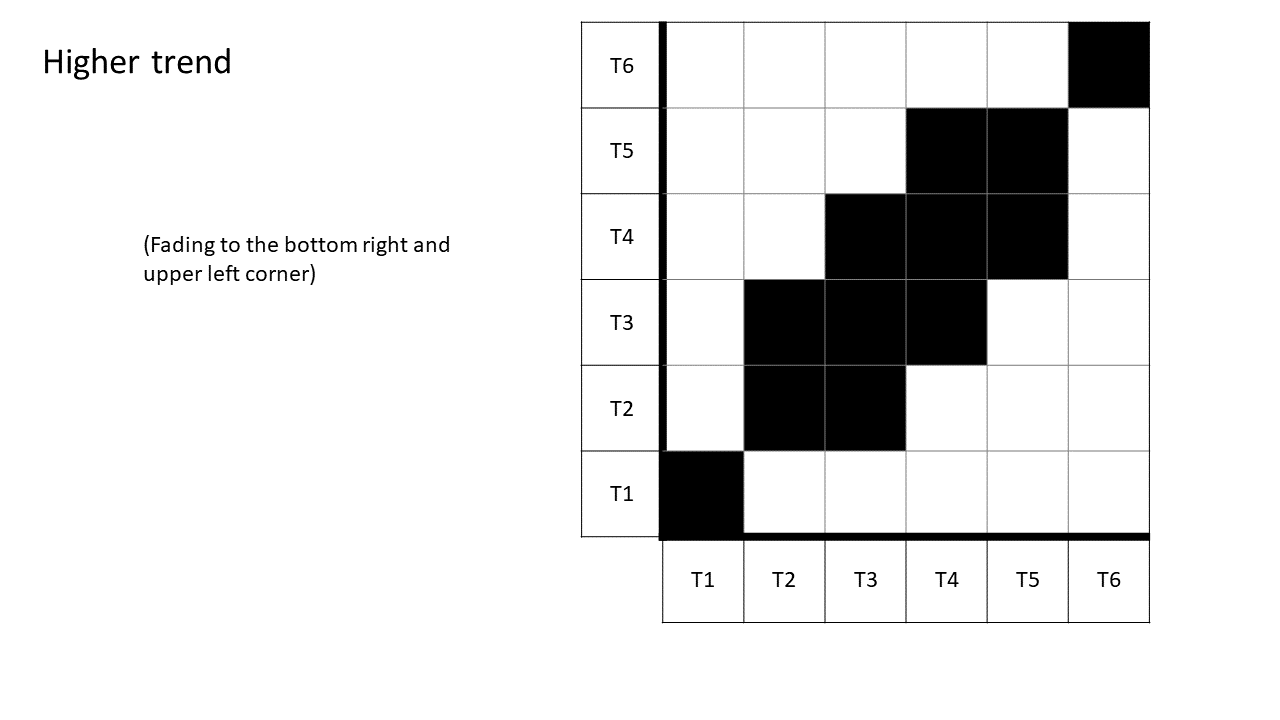
Determinism
What it depicts: The proportion of all recurrent points which land on diagonal lines, meaning that there is a pattern to re-occurrence. For example, motivation for physical activity might be high (or low) on the same weekdays for several weeks in a row, indicating high determinism. Sleep-wake cycles would also show high determinism, whereas random numbers would show no discernable patterns and the lowest possible determinism values.
knitr::include_graphics(path = "./figures/RQA_measures/determinismlo.PNG")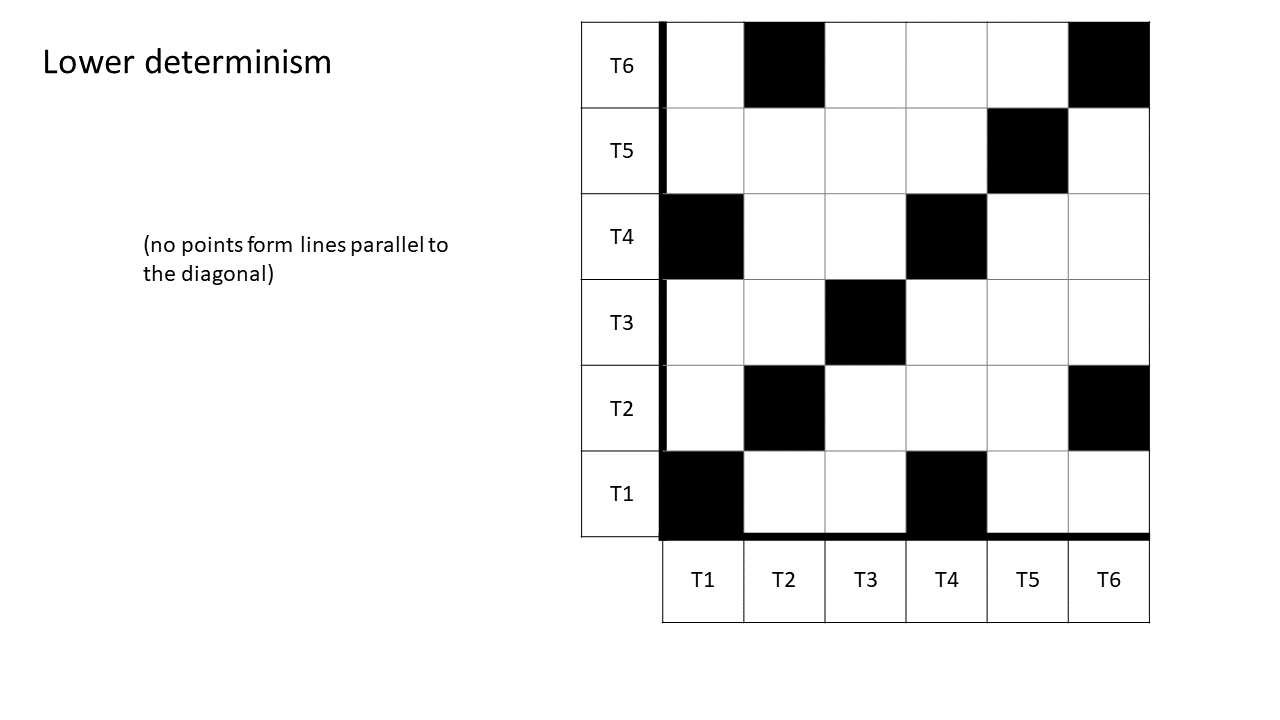
knitr::include_graphics(path = "./figures/RQA_measures/determinismhi.PNG")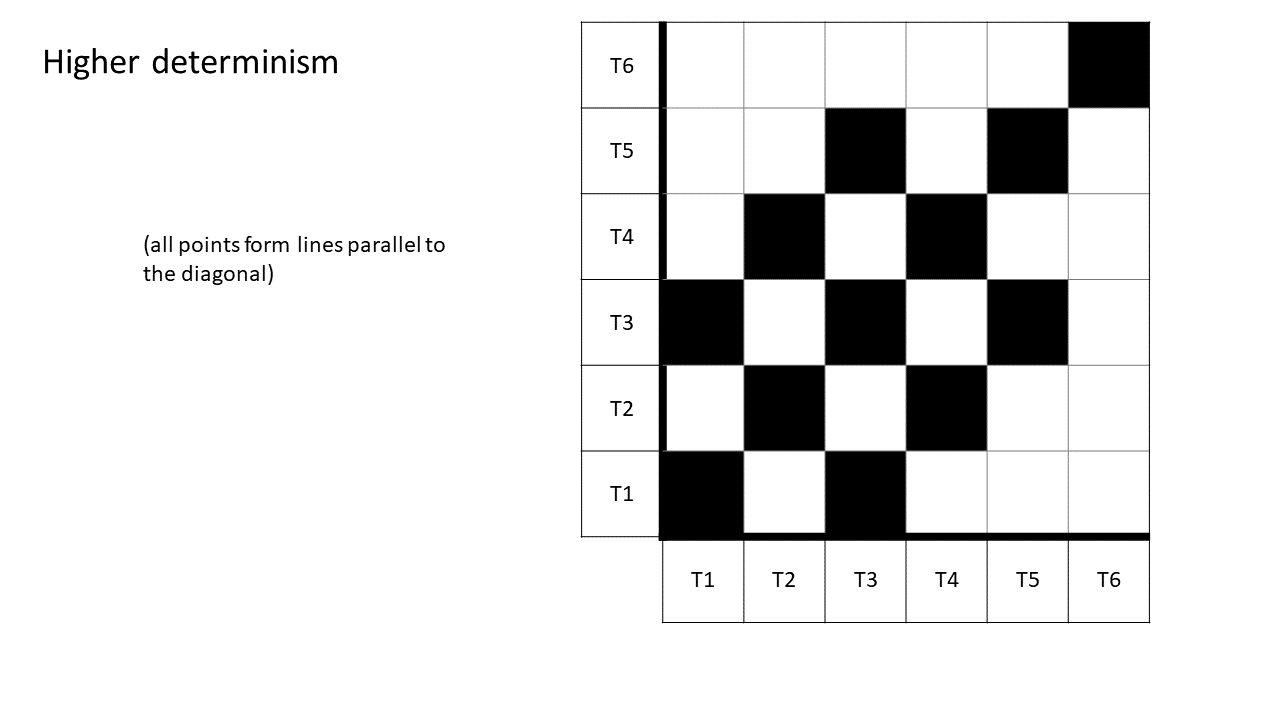
Trapping time and Laminarity
What it depicts: Laminarity is the proportion or recurrent points, which form vertical lines. Trapping time, on the other hand, depicts the average length of vertical line structures; it quantifies the time series’ tendency to get “stuck” on particular values or states. Trapping time could indicate a lack of healthy variability*, which in turn could be indicative of a system performing suboptimally or exhibiting maladaptive behaviour.
* Navarro, J., & Rueff-Lopes, R. (2015). Healthy variability in organizational behavior: Empirical evidence and new steps for future research. Nonlinear Dynamics, Psychology, and Life Sciences, 19(4), 529–552.
knitr::include_graphics(path = "./figures/RQA_measures/trappingtimelo.PNG")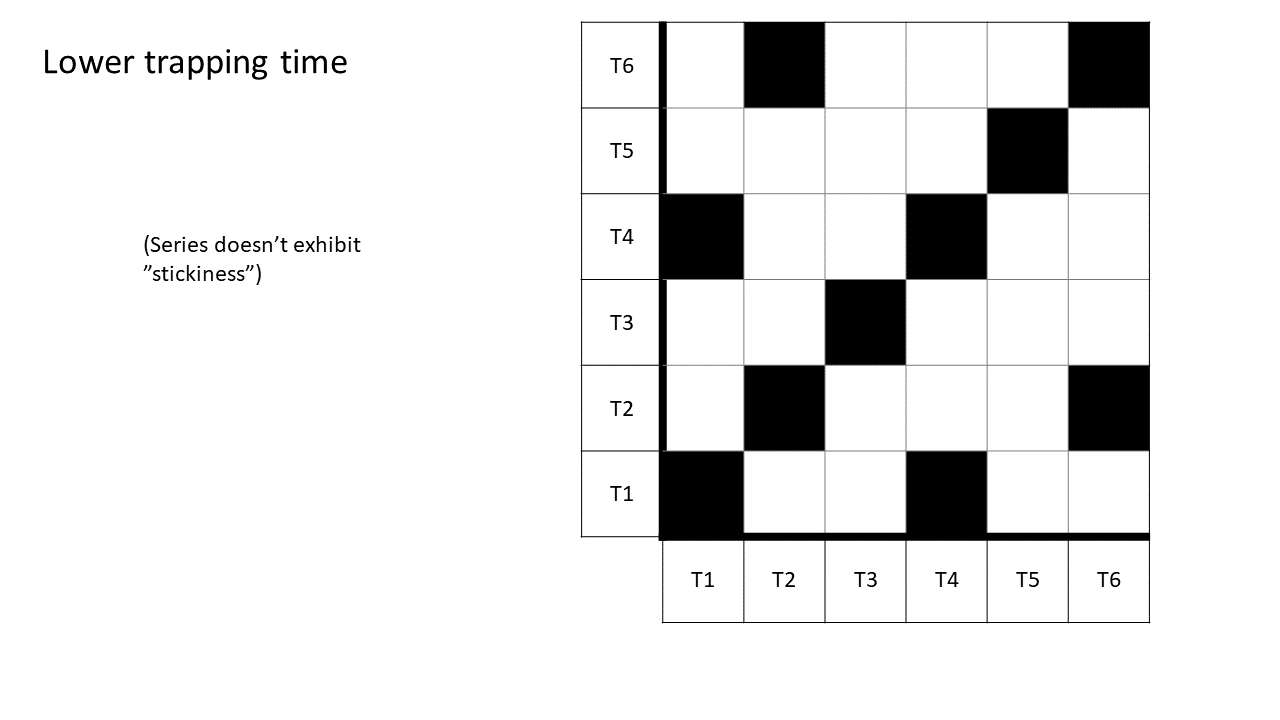
knitr::include_graphics(path = "./figures/RQA_measures/trappingtimehi.PNG")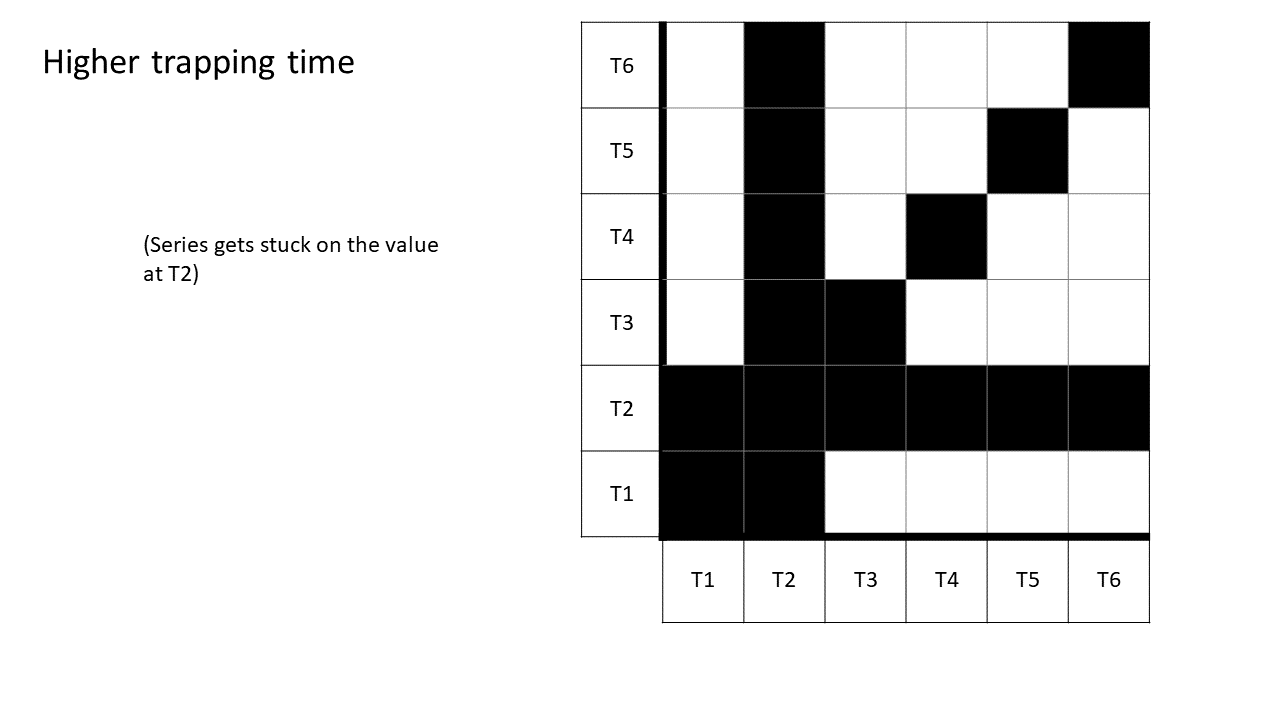
Entropy
What it depicts: The complexity or unpredictability of pattern lengths (i.e. variability in the length of the lines that are parallel to the diagonal); the heart rate of a person playing in a soccer match would show high entropy, whereas their heart rate in a training session of regular timed sprints would show low entropy.
knitr::include_graphics(path = "./figures/RQA_measures/entropylo.PNG")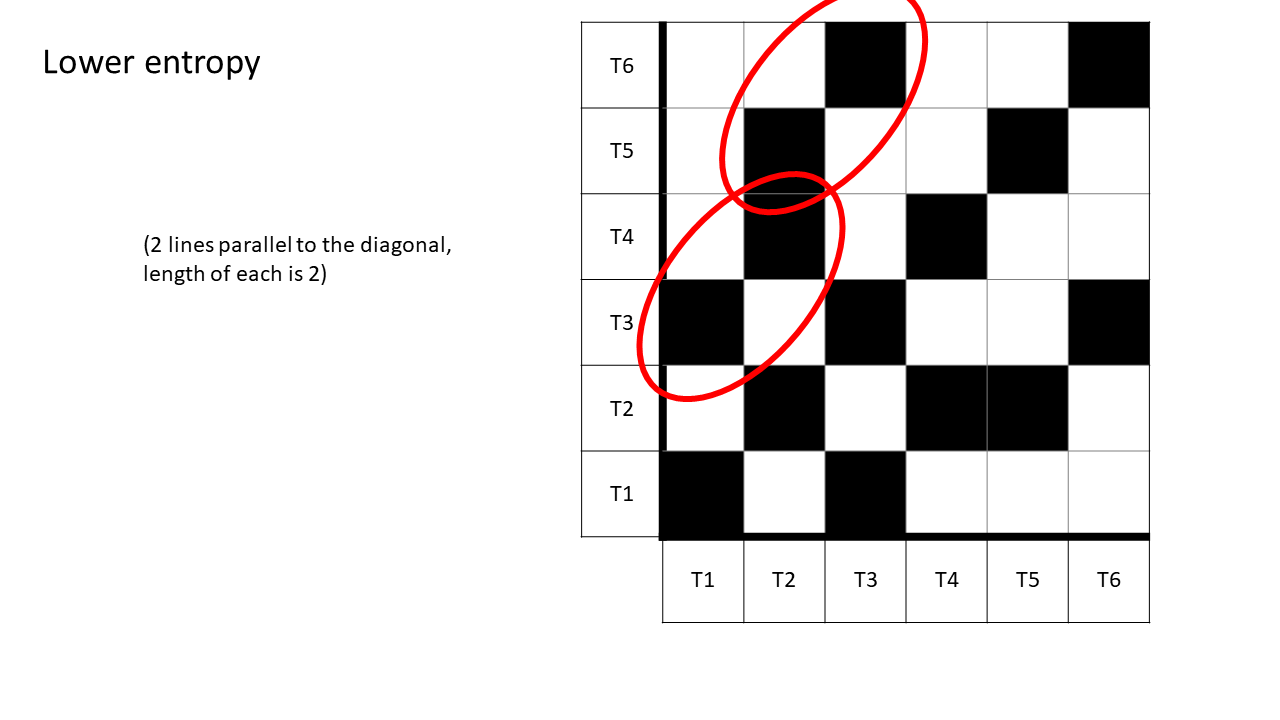
knitr::include_graphics(path = "./figures/RQA_measures/entropyhi.PNG")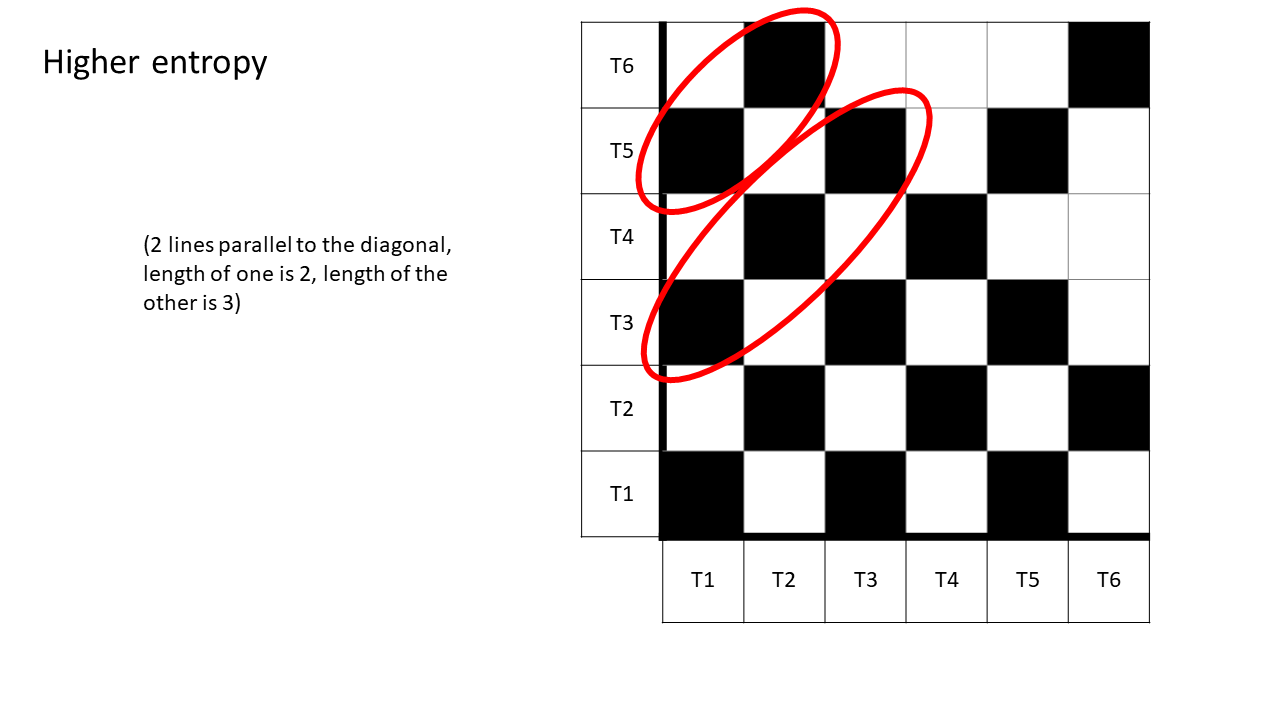
Average diagonal line length
What it depicts: The average length of the diagonal line structures, that is, the average time the system repeats a behavioural sequence it has exhibited previously. This can be thought of e.g. as a person’s (or their motivational system’s) consistency in repeating habitual behaviour, such as walking many steps during weekdays and little during weekends; a weekend with many steps (or a weekday with few steps) would break this pattern and reduce the average diagonal line length. Hence: While entropy can be thought of as a type of variance of the diagonal lines lengths, average diagonal line length would represent their mean length. Average diagonal line length can also be interpreted as the mean prediction time.
knitr::include_graphics(path = "./figures/RQA_measures/averagelinelengthlo.PNG")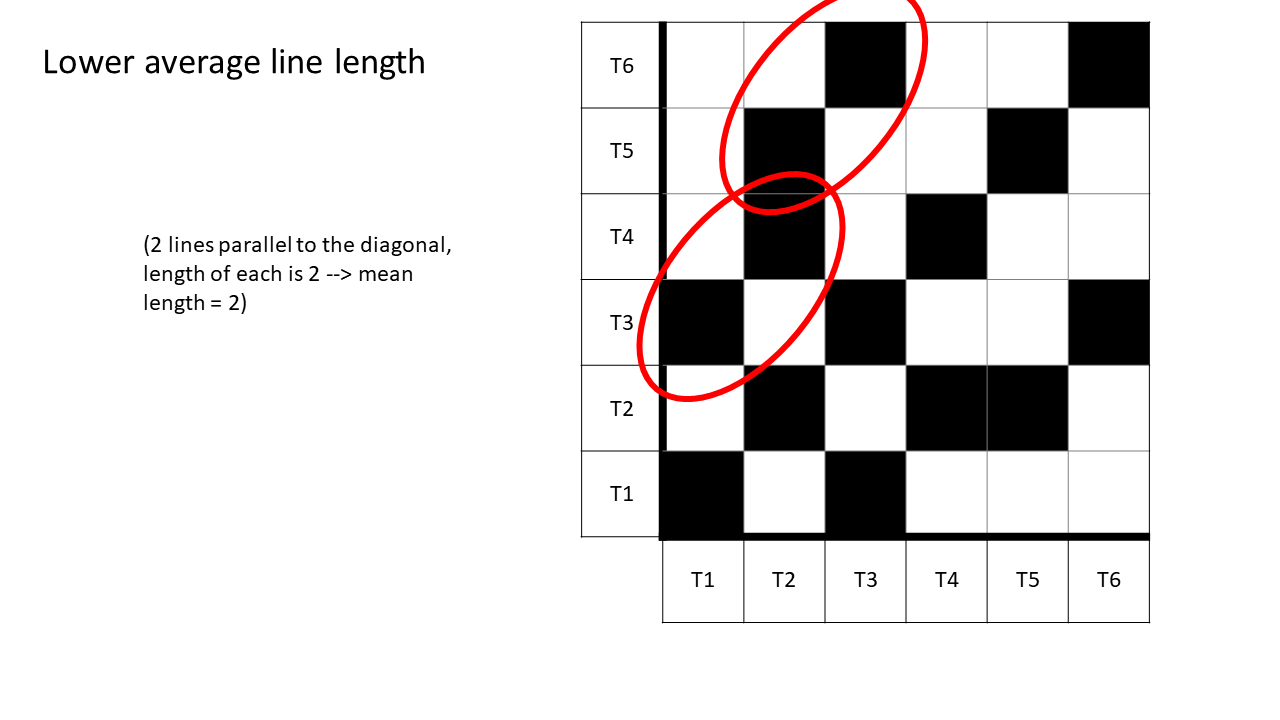
knitr::include_graphics(path = "./figures/RQA_measures/averagelinelengthhi.PNG")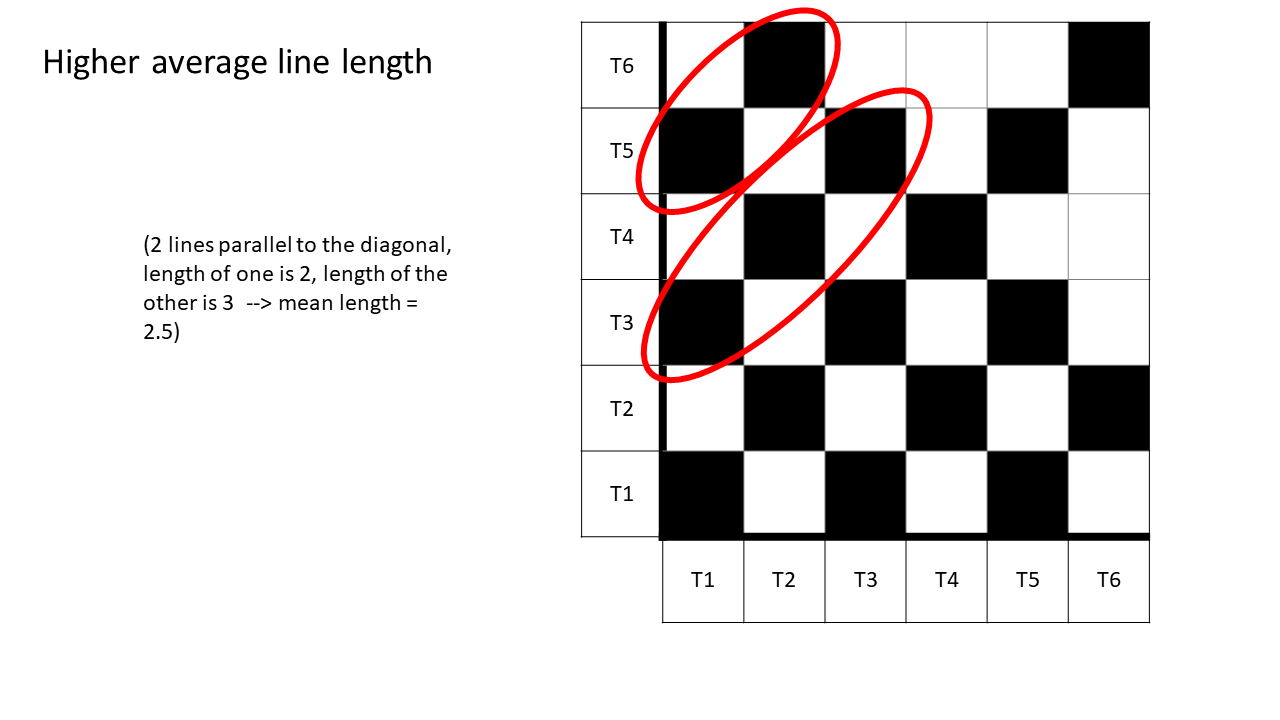
Possible substantive research questions include:
- Is trapping time related to inflexible behaviour (e.g., inability to adapt to environmental demands), and are interventions that lessen it analogous to “loosening up” a person’s reaction repertoire?
- Does an intervention destabilise the dynamics of a maladaptive target behaviour, leading to increased entropy in recurrence structures?
- At which periods in a time series is the target behaviour stationary, and do initiations of trends collide with interventions, indicating intervention’s impact?
- How is determinism connected to facets of habit theory?
- Does average diagonal line length go down (conferring decreased predictability with past data) when an intervention is introduced, indicating a shift in the system’s dynamics?
\(~\)
Cross-Recurrence Quantification Analysis
Cross-Recurrence Quantification Analysis, or CRQA, is a method of studying the coupling of two time series. As with other types of RQA, the first step of the analysis involves creating recurrence plots. In recurrence plots, the re-occurrence of values is visualised by plotting a time series against another time series (to explore cross-recurrence) or itself (to explore auto-recurrence). Figure below depicts a cross-recurrence plot of two hypothetical time series with discrete states coded as 1 to 6: Yellow (1, 5, 4, 3, 2, 6) and Blue (5, 4, 3, 4, 3, 2). Black cells indicate places where the same value occurs in both series.
# knitr::include_graphics(path = "./figures/rqa_pedagogical.png")

grid::grid.raster(png::readPNG("./figures/rqa_pedagogical.png"))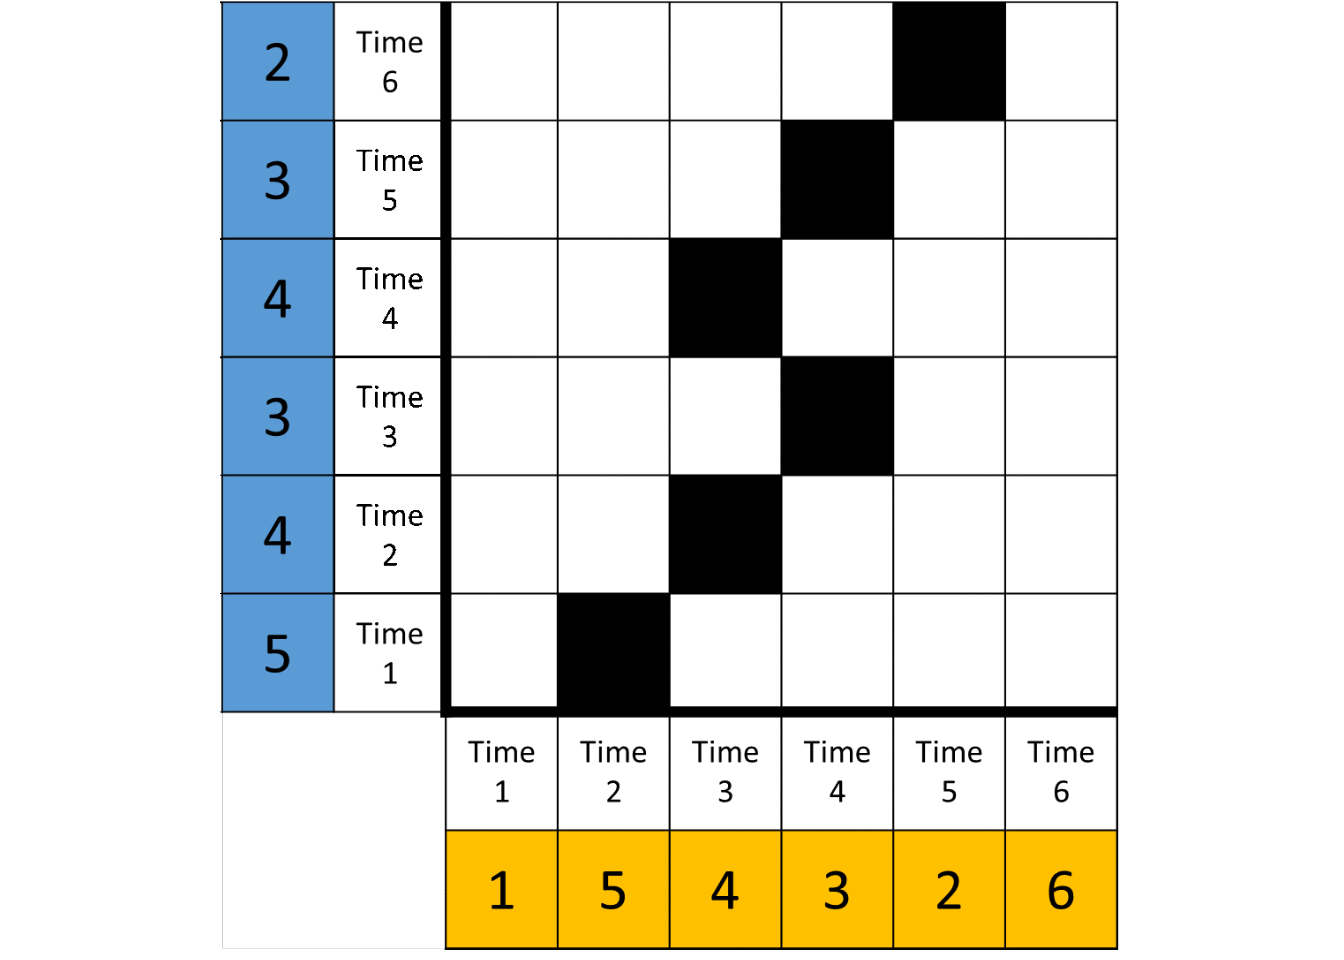
These data show a switch in the system state: the blue series precedes the yellow one until time 3-4, after which the yellow series precedes the blue one. While this is merely a pedagogical example (a time series of only six observations would rarely be sufficient to reliably identify patterns), it illustrates the utility of the method in identifying patterns in time series data. For a more in-depth treatment, see:
Wallot, S., & Leonardi, G. (2018). Analyzing Multivariate Dynamics Using Cross-Recurrence Quantification Analysis (CRQA), Diagonal-Cross-Recurrence Profiles (DCRP), and Multidimensional Recurrence Quantification Analysis (MdRQA) – A Tutorial in R. Frontiers in Psychology, 9. https://doi.org/10.3389/fpsyg.2018.02232
Coco, M. I., & Dale, R. (2014). Cross-recurrence quantification analysis of categorical and continuous time series: an R package. Frontiers in Psychology, 5. https://doi.org/10.3389/fpsyg.2014.00510
\(~\)
Session information
Description of the R environment can be found below.
devtools::session_info()
## - Session info -------------
##  setting
##  version
##  os
##  system
##  ui
##  language
##  collate
##  ctype
##  tz
##  date
##  value
##  R version 4.0.5 (2021-03-31)
##  Windows 10 x64
##  x86_64, mingw32
##  RStudio
##  (EN)
##  Finnish_Finland.1252
##  Finnish_Finland.1252
##  Europe/Helsinki
##  2021-05-19
##
## - Packages -----------------
##  package            *
##  abind
##  assertthat
##  backports
##  base64enc
##  BiocManager
##  bookdown           *
##  brainGraph
##  broom
##  bslib
##  cachem
##  callr
##  casnet
##  cellranger
##  checkmate
##  cli
##  cluster
##  codetools
##  colorspace
##  corpcor
##  cowplot
##  crayon
##  crosstalk
##  curl
##  data.table
##  DBI
##  dbplyr
##  desc
##  devtools
##  digest
##  DirectedClustering
##  doParallel
##  dplyr              *
##  DT
##  ellipsis
##  evaluate
##  fansi
##  farver
##  fastmap
##  fdrtool
##  forcats            *
##  foreach
##  forecast
##  foreign
##  Formula
##  fracdiff
##  fs
##  generics
##  ggimage
##  ggplot2            *
##  ggplotify
##  glasso
##  glue
##  gridExtra
##  gridGraphics
##  gtable
##  gtools
##  haven
##  highr
##  Hmisc
##  hms
##  htmlTable
##  htmltools
##  htmlwidgets
##  httpuv
##  httr
##  igraph
##  invctr
##  iterators
##  jpeg
##  jquerylib
##  jsonlite
##  knitr              *
##  labeling
##  later
##  lattice
##  latticeExtra
##  lavaan
##  leaps
##  lifecycle
##  lmtest
##  locfit
##  lubridate
##  magick
##  magrittr
##  MASS
##  Matrix
##  memoise
##  mgcv
##  mime
##  mnormt
##  modelr
##  munsell
##  nlme
##  nnet
##  pander
##  patchwork          *
##  pbapply
##  pbivnorm
##  permute
##  pillar
##  pkgbuild
##  pkgconfig
##  pkgload
##  plyr
##  png
##  prettyunits
##  processx
##  promises
##  proxy
##  ps
##  psych
##  purrr              *
##  qgraph
##  quadprog
##  quantmod
##  R6
##  randtests
##  RColorBrewer
##  Rcpp
##  readr              *
##  readxl
##  remotes
##  reprex
##  reshape2
##  rlang
##  rmarkdown
##  rpart
##  rprojroot
##  rstudioapi
##  rvcheck
##  rvest
##  sass
##  scales
##  sessioninfo
##  shiny              *
##  stabledist
##  stringi
##  stringr            *
##  survival
##  testthat
##  tibble             *
##  tidyr              *
##  tidyselect
##  tidyverse          *
##  timeDate
##  tmvnsim
##  TSA
##  tseries
##  TTR
##  urca
##  usethis
##  utf8
##  vctrs
##  viridisLite
##  withr
##  xfun
##  xml2
##  xtable
##  xts
##  yaml
##  zoo
##  version    date       lib
##  1.4-5      2016-07-21 [1]
##  0.2.1      2019-03-21 [1]
##  1.2.1      2020-12-09 [1]
##  0.1-3      2015-07-28 [1]
##  1.30.12    2021-03-28 [1]
##  0.21       2020-10-13 [1]
##  3.0.0      2020-09-29 [1]
##  0.7.6.9001 2021-04-19 [1]
##  0.2.4      2021-01-25 [1]
##  1.0.4      2021-02-13 [1]
##  3.6.0      2021-03-28 [1]
##  0.1.6      2021-05-17 [1]
##  1.1.0      2016-07-27 [1]
##  2.0.0      2020-02-06 [1]
##  2.4.0      2021-04-05 [1]
##  2.1.1      2021-02-14 [2]
##  0.2-18     2020-11-04 [2]
##  2.0-0      2020-11-11 [1]
##  1.6.9      2017-04-01 [1]
##  1.1.1      2020-12-30 [1]
##  1.4.1      2021-02-08 [1]
##  1.1.1      2021-01-12 [1]
##  4.3        2019-12-02 [1]
##  1.14.0     2021-02-21 [1]
##  1.1.1      2021-01-15 [1]
##  2.1.1      2021-04-06 [1]
##  1.3.0      2021-03-05 [1]
##  2.4.0      2021-04-07 [1]
##  0.6.27     2020-10-24 [1]
##  0.1.1      2018-01-11 [1]
##  1.0.16     2020-10-16 [1]
##  1.0.5      2021-03-05 [1]
##  0.18       2021-04-14 [1]
##  0.3.1      2020-05-15 [1]
##  0.14       2019-05-28 [1]
##  0.4.2      2021-01-15 [1]
##  2.1.0      2021-02-28 [1]
##  1.1.0      2021-01-25 [1]
##  1.2.16     2021-01-06 [1]
##  0.5.1      2021-01-27 [1]
##  1.5.1      2020-10-15 [1]
##  8.14       2021-03-11 [1]
##  0.8-81     2020-12-22 [2]
##  1.2-4      2020-10-16 [1]
##  1.5-1      2020-01-24 [1]
##  1.5.0      2020-07-31 [1]
##  0.1.0      2020-10-31 [1]
##  0.2.8      2020-04-02 [1]
##  3.3.3      2020-12-30 [1]
##  0.0.5      2020-03-12 [1]
##  1.11       2019-10-01 [1]
##  1.4.2      2020-08-27 [1]
##  2.3        2017-09-09 [1]
##  0.5-1      2020-12-13 [1]
##  0.3.0      2019-03-25 [1]
##  3.8.2      2020-03-31 [1]
##  2.3.1      2020-06-01 [1]
##  0.9        2021-04-16 [1]
##  4.5-0      2021-02-28 [1]
##  1.0.0      2021-01-13 [1]
##  2.1.0      2020-09-16 [1]
##  0.5.1.1    2021-01-22 [1]
##  1.5.3      2020-12-10 [1]
##  1.5.5      2021-01-13 [1]
##  1.4.2      2020-07-20 [1]
##  1.2.6      2020-10-06 [1]
##  0.1.0      2019-03-07 [1]
##  1.0.13     2020-10-15 [1]
##  0.1-8.1    2019-10-24 [1]
##  0.1.3      2020-12-17 [1]
##  1.7.2      2020-12-09 [1]
##  1.32       2021-04-14 [1]
##  0.4.2      2020-10-20 [1]
##  1.1.0.1    2020-06-05 [1]
##  0.20-41    2020-04-02 [2]
##  0.6-29     2019-12-19 [1]
##  0.6-8      2021-03-10 [1]
##  3.1        2020-01-16 [1]
##  1.0.0      2021-02-15 [1]
##  0.9-38     2020-09-09 [1]
##  1.5-9.4    2020-03-25 [1]
##  1.7.10     2021-02-26 [1]
##  2.7.1      2021-03-20 [1]
##  2.0.1      2020-11-17 [1]
##  7.3-53.1   2021-02-12 [2]
##  1.3-2      2021-01-06 [2]
##  2.0.0      2021-01-26 [1]
##  1.8-34     2021-02-16 [2]
##  0.10       2021-02-13 [1]
##  2.0.2      2020-09-01 [1]
##  0.1.8      2020-05-19 [1]
##  0.5.0      2018-06-12 [1]
##  3.1-152    2021-02-04 [2]
##  7.3-15     2021-01-24 [2]
##  0.6.3      2018-11-06 [1]
##  1.1.1      2020-12-17 [1]
##  1.4-3      2020-08-18 [1]
##  0.6.0      2015-01-23 [1]
##  0.9-5      2019-03-12 [1]
##  1.6.0      2021-04-13 [1]
##  1.2.0      2020-12-15 [1]
##  2.0.3      2019-09-22 [1]
##  1.2.1      2021-04-06 [1]
##  1.8.6      2020-03-03 [1]
##  0.1-7      2013-12-03 [1]
##  1.1.1      2020-01-24 [1]
##  3.5.1      2021-04-04 [1]
##  1.2.0.1    2021-02-11 [1]
##  0.4-25     2021-03-05 [1]
##  1.6.0      2021-02-28 [1]
##  2.1.3      2021-03-27 [1]
##  0.3.4      2020-04-17 [1]
##  1.6.9      2021-01-28 [1]
##  1.5-8      2019-11-20 [1]
##  0.4.18     2020-12-09 [1]
##  2.5.0      2020-10-28 [1]
##  1.0        2014-11-17 [1]
##  1.1-2      2014-12-07 [1]
##  1.0.6      2021-01-15 [1]
##  1.4.0      2020-10-05 [1]
##  1.3.1      2019-03-13 [1]
##  2.3.0      2021-04-01 [1]
##  2.0.0      2021-04-02 [1]
##  1.4.4      2020-04-09 [1]
##  0.4.10     2020-12-30 [1]
##  2.7        2021-02-19 [1]
##  4.1-15     2019-04-12 [2]
##  2.0.2      2020-11-15 [1]
##  0.13       2020-11-12 [1]
##  0.1.8      2020-03-01 [1]
##  1.0.0      2021-03-09 [1]
##  0.3.1      2021-01-24 [1]
##  1.1.1      2020-05-11 [1]
##  1.1.1      2018-11-05 [1]
##  1.6.0      2021-01-25 [1]
##  0.7-1      2016-09-12 [1]
##  1.5.3      2020-09-09 [1]
##  1.4.0      2019-02-10 [1]
##  3.2-10     2021-03-16 [2]
##  3.0.2      2021-02-14 [1]
##  3.1.1      2021-04-18 [1]
##  1.1.3      2021-03-03 [1]
##  1.1.0      2020-05-11 [1]
##  1.3.1      2021-04-15 [1]
##  3043.102   2018-02-21 [1]
##  1.0-2      2016-12-15 [1]
##  1.3        2020-09-13 [1]
##  0.10-48    2020-12-04 [1]
##  0.24.2     2020-09-01 [1]
##  1.3-0      2016-09-06 [1]
##  2.0.1      2021-02-10 [1]
##  1.2.1      2021-03-12 [1]
##  0.3.7      2021-03-29 [1]
##  0.3.0      2018-02-01 [1]
##  2.4.2      2021-04-18 [1]
##  0.22       2021-03-11 [1]
##  1.3.2      2020-04-23 [1]
##  1.8-4      2019-04-21 [1]
##  0.12.1     2020-09-09 [1]
##  2.2.1      2020-02-01 [1]
##  1.8-9      2021-03-09 [1]
##  source
##  CRAN (R 4.0.3)
##  CRAN (R 4.0.5)
##  CRAN (R 4.0.3)
##  CRAN (R 4.0.3)
##  CRAN (R 4.0.5)
##  CRAN (R 4.0.5)
##  CRAN (R 4.0.5)
##  Github (tidymodels/broom@0f4c1ca)
##  CRAN (R 4.0.5)
##  CRAN (R 4.0.5)
##  CRAN (R 4.0.4)
##  Github (fredhasselman/casnet@bb112ee)
##  CRAN (R 4.0.5)
##  CRAN (R 4.0.5)
##  CRAN (R 4.0.4)
##  CRAN (R 4.0.5)
##  CRAN (R 4.0.5)
##  CRAN (R 4.0.5)
##  CRAN (R 4.0.3)
##  CRAN (R 4.0.5)
##  CRAN (R 4.0.5)
##  CRAN (R 4.0.5)
##  CRAN (R 4.0.5)
##  CRAN (R 4.0.5)
##  CRAN (R 4.0.5)
##  CRAN (R 4.0.5)
##  CRAN (R 4.0.5)
##  CRAN (R 4.0.4)
##  CRAN (R 4.0.5)
##  CRAN (R 4.0.5)
##  CRAN (R 4.0.5)
##  CRAN (R 4.0.5)
##  CRAN (R 4.0.5)
##  CRAN (R 4.0.5)
##  CRAN (R 4.0.5)
##  CRAN (R 4.0.5)
##  CRAN (R 4.0.5)
##  CRAN (R 4.0.5)
##  CRAN (R 4.0.3)
##  CRAN (R 4.0.5)
##  CRAN (R 4.0.5)
##  CRAN (R 4.0.5)
##  CRAN (R 4.0.5)
##  CRAN (R 4.0.3)
##  CRAN (R 4.0.5)
##  CRAN (R 4.0.5)
##  CRAN (R 4.0.5)
##  CRAN (R 4.0.5)
##  CRAN (R 4.0.5)
##  CRAN (R 4.0.5)
##  CRAN (R 4.0.3)
##  CRAN (R 4.0.5)
##  CRAN (R 4.0.5)
##  CRAN (R 4.0.5)
##  CRAN (R 4.0.5)
##  CRAN (R 4.0.3)
##  CRAN (R 4.0.5)
##  CRAN (R 4.0.5)
##  CRAN (R 4.0.5)
##  CRAN (R 4.0.5)
##  CRAN (R 4.0.5)
##  CRAN (R 4.0.5)
##  CRAN (R 4.0.5)
##  CRAN (R 4.0.5)
##  CRAN (R 4.0.5)
##  CRAN (R 4.0.5)
##  CRAN (R 4.0.5)
##  CRAN (R 4.0.5)
##  CRAN (R 4.0.3)
##  CRAN (R 4.0.5)
##  CRAN (R 4.0.5)
##  CRAN (R 4.0.5)
##  CRAN (R 4.0.3)
##  CRAN (R 4.0.5)
##  CRAN (R 4.0.5)
##  CRAN (R 4.0.5)
##  CRAN (R 4.0.5)
##  CRAN (R 4.0.5)
##  CRAN (R 4.0.5)
##  CRAN (R 4.0.5)
##  CRAN (R 4.0.5)
##  CRAN (R 4.0.5)
##  CRAN (R 4.0.5)
##  CRAN (R 4.0.5)
##  CRAN (R 4.0.5)
##  CRAN (R 4.0.5)
##  CRAN (R 4.0.5)
##  CRAN (R 4.0.5)
##  CRAN (R 4.0.4)
##  CRAN (R 4.0.3)
##  CRAN (R 4.0.5)
##  CRAN (R 4.0.5)
##  CRAN (R 4.0.5)
##  CRAN (R 4.0.5)
##  CRAN (R 4.0.5)
##  CRAN (R 4.0.5)
##  CRAN (R 4.0.3)
##  CRAN (R 4.0.3)
##  CRAN (R 4.0.5)
##  CRAN (R 4.0.5)
##  CRAN (R 4.0.5)
##  CRAN (R 4.0.5)
##  CRAN (R 4.0.4)
##  CRAN (R 4.0.5)
##  CRAN (R 4.0.3)
##  CRAN (R 4.0.5)
##  CRAN (R 4.0.5)
##  CRAN (R 4.0.5)
##  CRAN (R 4.0.5)
##  CRAN (R 4.0.5)
##  CRAN (R 4.0.5)
##  CRAN (R 4.0.5)
##  CRAN (R 4.0.5)
##  CRAN (R 4.0.3)
##  CRAN (R 4.0.5)
##  CRAN (R 4.0.5)
##  CRAN (R 4.0.3)
##  CRAN (R 4.0.3)
##  CRAN (R 4.0.4)
##  CRAN (R 4.0.5)
##  CRAN (R 4.0.5)
##  CRAN (R 4.0.5)
##  CRAN (R 4.0.5)
##  CRAN (R 4.0.5)
##  CRAN (R 4.0.5)
##  CRAN (R 4.0.5)
##  CRAN (R 4.0.5)
##  CRAN (R 4.0.5)
##  CRAN (R 4.0.5)
##  CRAN (R 4.0.5)
##  CRAN (R 4.0.5)
##  CRAN (R 4.0.5)
##  CRAN (R 4.0.5)
##  CRAN (R 4.0.5)
##  CRAN (R 4.0.5)
##  CRAN (R 4.0.5)
##  CRAN (R 4.0.3)
##  CRAN (R 4.0.5)
##  CRAN (R 4.0.5)
##  CRAN (R 4.0.5)
##  CRAN (R 4.0.5)
##  CRAN (R 4.0.5)
##  CRAN (R 4.0.5)
##  CRAN (R 4.0.5)
##  CRAN (R 4.0.4)
##  CRAN (R 4.0.3)
##  CRAN (R 4.0.5)
##  CRAN (R 4.0.5)
##  CRAN (R 4.0.5)
##  CRAN (R 4.0.5)
##  CRAN (R 4.0.5)
##  CRAN (R 4.0.5)
##  CRAN (R 4.0.5)
##  CRAN (R 4.0.5)
##  CRAN (R 4.0.5)
##  CRAN (R 4.0.5)
##  CRAN (R 4.0.5)
##  CRAN (R 4.0.5)
##  CRAN (R 4.0.5)
##  CRAN (R 4.0.4)
##  CRAN (R 4.0.5)
##
## [1] C:/rlibs/4.0.5
## [2] C:/Program Files/R/R-4.0.5/library

pander::pander(sessionInfo())
R version 4.0.5 (2021-03-31)
Platform: x86_64-w64-mingw32/x64 (64-bit)
locale: LC_COLLATE=Finnish_Finland.1252, LC_CTYPE=Finnish_Finland.1252, LC_MONETARY=Finnish_Finland.1252, LC_NUMERIC=C and LC_TIME=Finnish_Finland.1252
attached base packages: stats, graphics, grDevices, utils, datasets, methods and base
other attached packages: patchwork(v.1.1.1), bookdown(v.0.21), knitr(v.1.32), shiny(v.1.6.0), forcats(v.0.5.1), stringr(v.1.4.0), dplyr(v.1.0.5), purrr(v.0.3.4), readr(v.1.4.0), tidyr(v.1.1.3), tibble(v.3.1.1), ggplot2(v.3.3.3) and tidyverse(v.1.3.1)
loaded via a namespace (and not attached): readxl(v.1.3.1), backports(v.1.2.1), Hmisc(v.4.5-0), plyr(v.1.8.6), igraph(v.1.2.6), splines(v.4.0.5), crosstalk(v.1.1.1), usethis(v.2.0.1), digest(v.0.6.27), foreach(v.1.5.1), casnet(v.0.1.6), htmltools(v.0.5.1.1), magick(v.2.7.1), fansi(v.0.4.2), magrittr(v.2.0.1), checkmate(v.2.0.0), memoise(v.2.0.0), cluster(v.2.1.1), doParallel(v.1.0.16), remotes(v.2.3.0), modelr(v.0.1.8), stabledist(v.0.7-1), xts(v.0.12.1), forecast(v.8.14), tseries(v.0.10-48), prettyunits(v.1.1.1), jpeg(v.0.1-8.1), colorspace(v.2.0-0), rvest(v.1.0.0), haven(v.2.3.1), xfun(v.0.22), callr(v.3.6.0), crayon(v.1.4.1), jsonlite(v.1.7.2), survival(v.3.2-10), zoo(v.1.8-9), iterators(v.1.0.13), glue(v.1.4.2), gtable(v.0.3.0), pkgbuild(v.1.2.0), DirectedClustering(v.0.1.1), quantmod(v.0.4.18), abind(v.1.4-5), scales(v.1.1.1), DBI(v.1.1.1), Rcpp(v.1.0.6), xtable(v.1.8-4), viridisLite(v.0.3.0), htmlTable(v.2.1.0), tmvnsim(v.1.0-2), gridGraphics(v.0.5-1), foreign(v.0.8-81), proxy(v.0.4-25), brainGraph(v.3.0.0), Formula(v.1.2-4), randtests(v.1.0), DT(v.0.18), stats4(v.4.0.5), htmlwidgets(v.1.5.3), httr(v.1.4.2), lavaan(v.0.6-8), RColorBrewer(v.1.1-2), ellipsis(v.0.3.1), pkgconfig(v.2.0.3), farver(v.2.1.0), sass(v.0.3.1), nnet(v.7.3-15), invctr(v.0.1.0), dbplyr(v.2.1.1), locfit(v.1.5-9.4), utf8(v.1.2.1), later(v.1.1.0.1), ggplotify(v.0.0.5), tidyselect(v.1.1.0), labeling(v.0.4.2), rlang(v.0.4.10), reshape2(v.1.4.4), munsell(v.0.5.0), cellranger(v.1.1.0), tools(v.4.0.5), cachem(v.1.0.4), cli(v.2.4.0), generics(v.0.1.0), devtools(v.2.4.0), broom(v.0.7.6.9001), fdrtool(v.1.2.16), evaluate(v.0.14), fastmap(v.1.1.0), yaml(v.2.2.1), processx(v.3.5.1), fs(v.1.5.0), pander(v.0.6.3), glasso(v.1.11), pbapply(v.1.4-3), nlme(v.3.1-152), mime(v.0.10), leaps(v.3.1), xml2(v.1.3.2), compiler(v.4.0.5), rstudioapi(v.0.13), curl(v.4.3), png(v.0.1-7), testthat(v.3.0.2), reprex(v.2.0.0), bslib(v.0.2.4), pbivnorm(v.0.6.0), stringi(v.1.5.3), ggimage(v.0.2.8), highr(v.0.9), ps(v.1.6.0), TSA(v.1.3), qgraph(v.1.6.9), desc(v.1.3.0), lattice(v.0.20-41), Matrix(v.1.3-2), psych(v.2.1.3), urca(v.1.3-0), permute(v.0.9-5), vctrs(v.0.3.7), pillar(v.1.6.0), lifecycle(v.1.0.0), BiocManager(v.1.30.12), lmtest(v.0.9-38), jquerylib(v.0.1.3), data.table(v.1.14.0), cowplot(v.1.1.1), corpcor(v.1.6.9), httpuv(v.1.5.5), R6(v.2.5.0), latticeExtra(v.0.6-29), promises(v.1.2.0.1), gridExtra(v.2.3), sessioninfo(v.1.1.1), codetools(v.0.2-18), gtools(v.3.8.2), MASS(v.7.3-53.1), assertthat(v.0.2.1), pkgload(v.1.2.1), rprojroot(v.2.0.2), withr(v.2.4.2), fracdiff(v.1.5-1), mnormt(v.2.0.2), mgcv(v.1.8-34), parallel(v.4.0.5), hms(v.1.0.0), timeDate(v.3043.102), quadprog(v.1.5-8), grid(v.4.0.5), rpart(v.4.1-15), rmarkdown(v.2.7), rvcheck(v.0.1.8), TTR(v.0.24.2), lubridate(v.1.7.10) and base64enc(v.0.1-3)